Key conclusions related to the statistical data of Bulgarian population in 2020, published by the National Statistical Institute (NSI)

In early April, the NSI published its annual statistics on demographic processes in the country in 2020. Data for previous years are always of great interest because of the trends they outline. Knowledge of the general situation in the country helps in the analysis of consumers and the environment in which the business is placed. In this topic we have collected the main key points from the current data, the impact of which we analyzed with the help of charts.

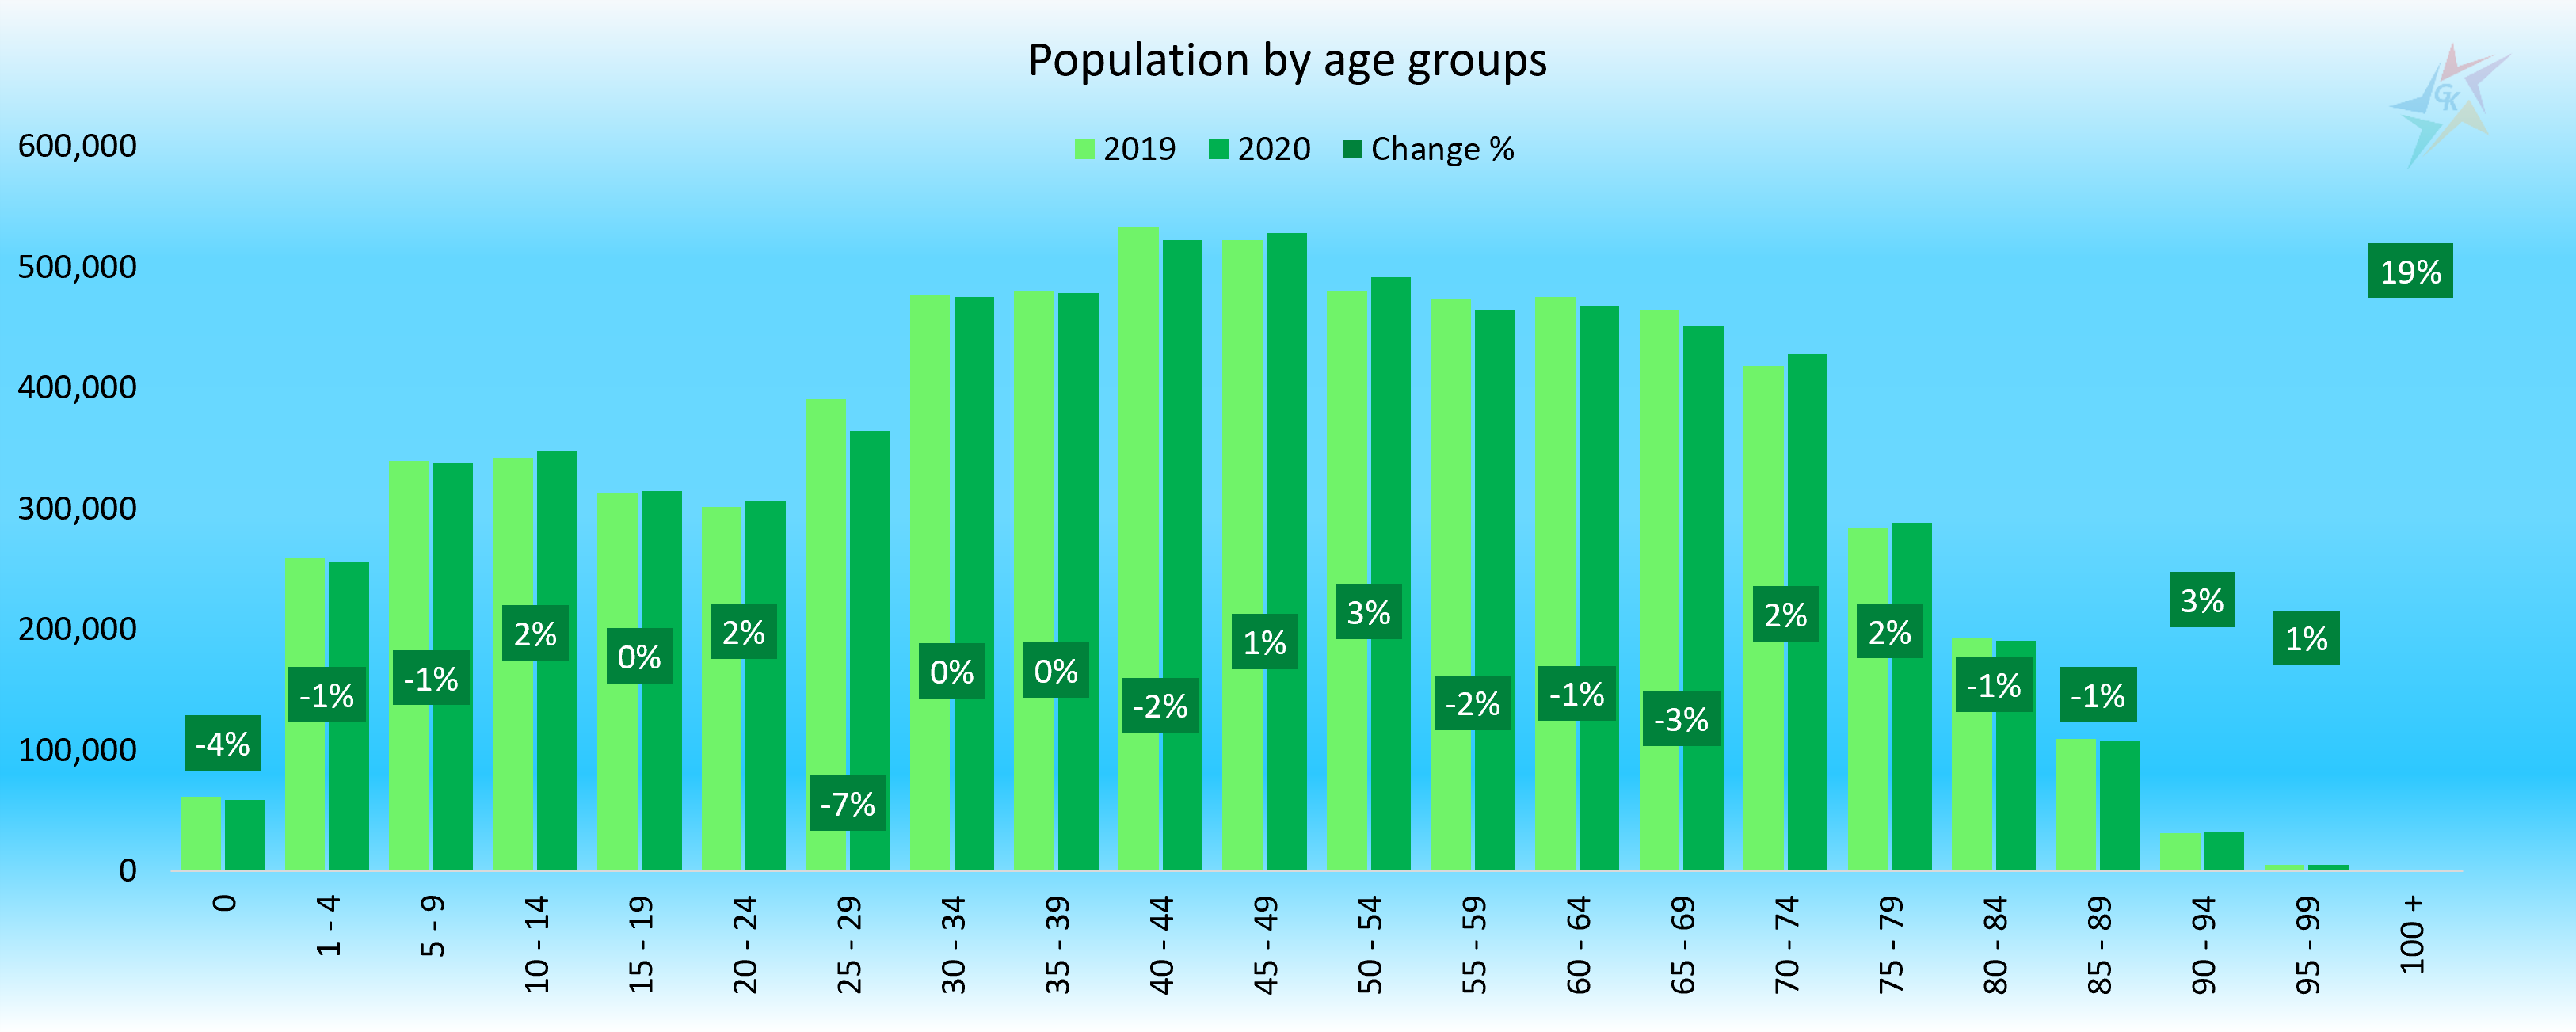
Declining and aging population of the country is one of the main trends, which is deepening in 2020. At the end of the year, the population of Bulgaria is 6,916,548 people, which means a decrease of 0.5% compared to 2019. For comparison, the population in the European Union is growing by 0.2% in 2020. Children under the age of 15 represent 14.4% of the total population. People at working age between 15 and 64 are 63.8%, and those aged 65+ are 21.8% of the nation. In 2020, the largest decline was registered by the economically active population – minus 0.7%, as well as children under 15 y.o. – minus 0.3%. The number of people in the oldest group remains unchanged, but their share compared to the other two groups rises by 0.1%. The chart presents the dynamics in different age groups in 2020 compared to 2019:

Source: NSI. Period: 2019-2020

The following graph shows the average age in Bulgaria for the last 20 years:

Source: NSI. Period: 2000-2020

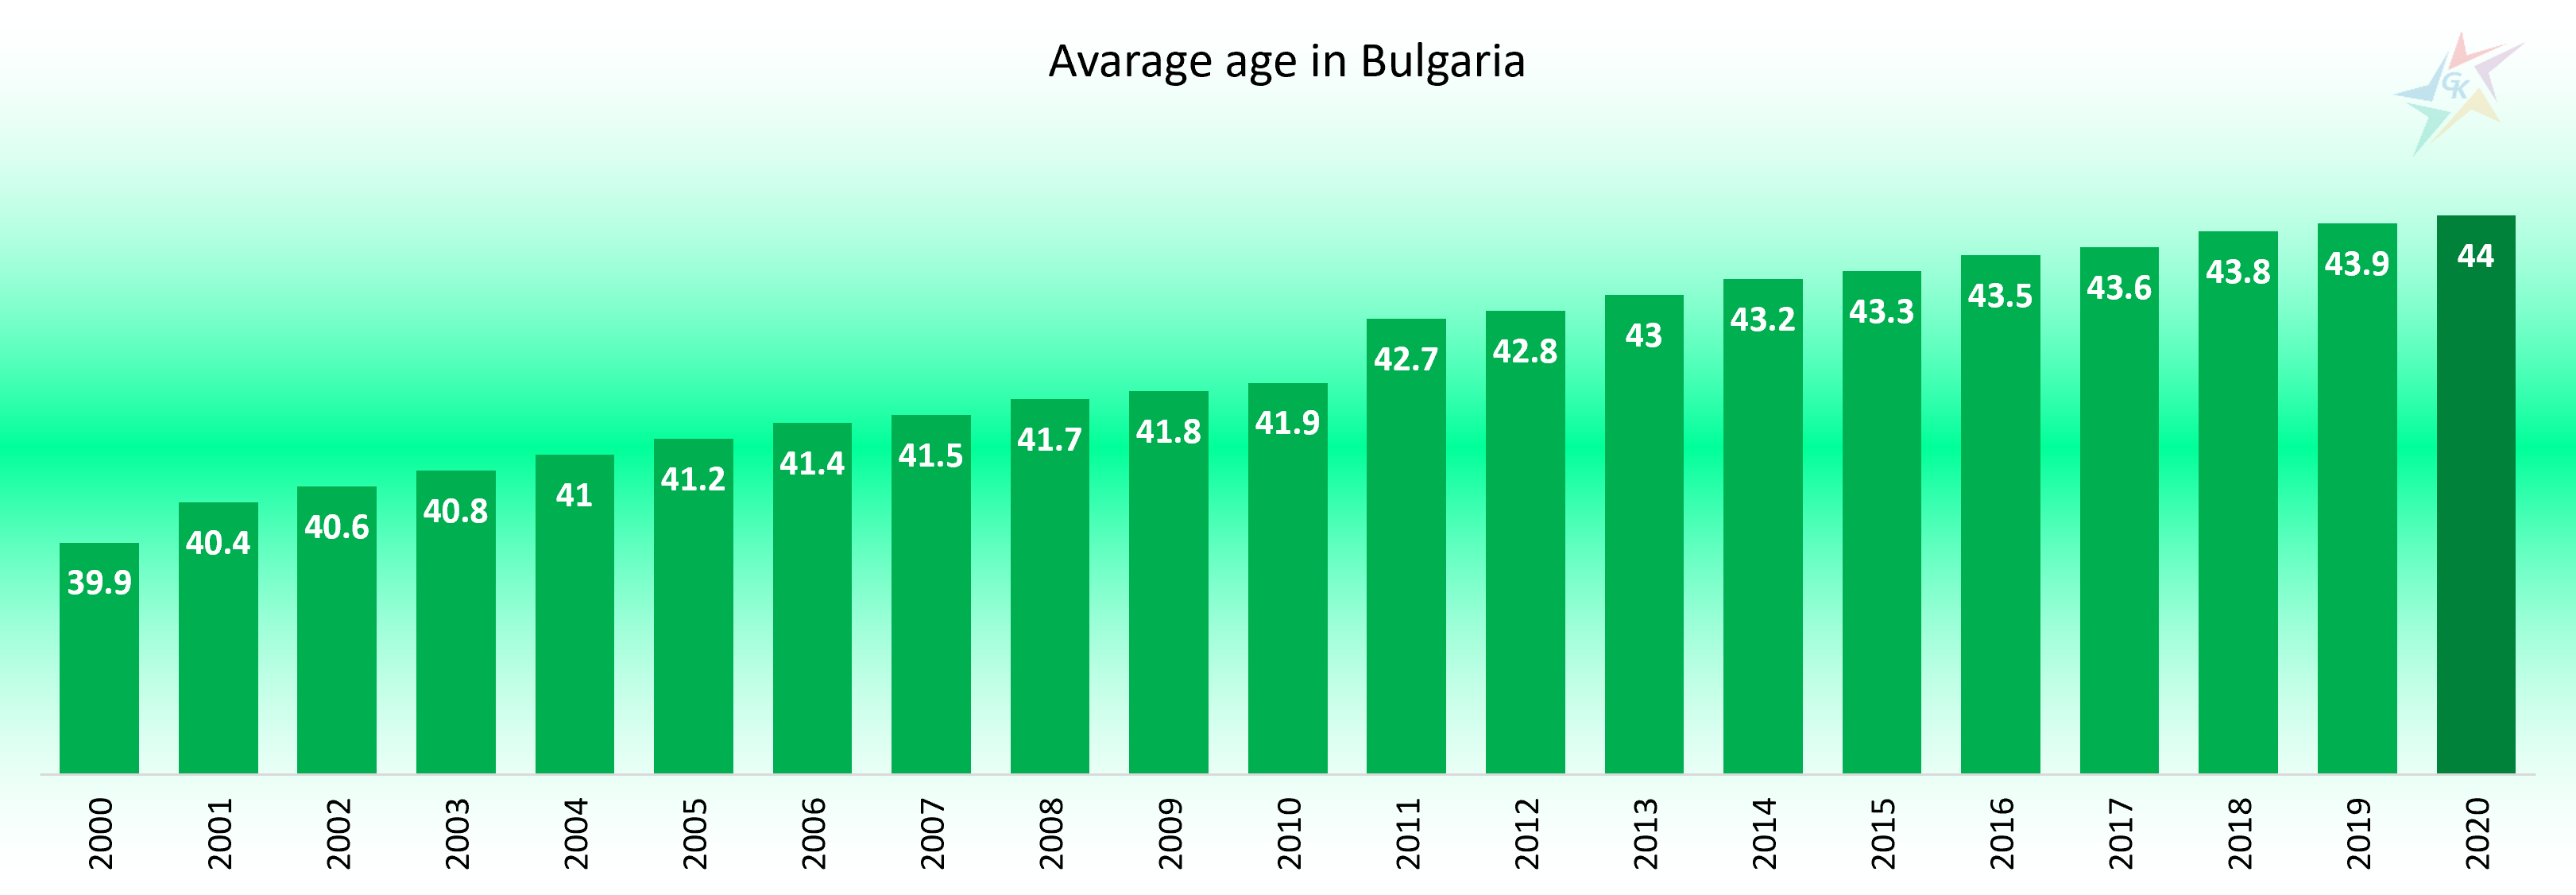
The past 2020 is another year in which the average age of the population in the country is rising. As of 31.12.2020 it reaches 44 years of age. The problem of aging is relevant throughout the EU community – in 2018 the average age reaches 43.1 years, and by 2050 it is expected to be 50 years.

In 2020, the share of women reaches 51.6%, which is 0.1% more than in 2019. There are 1,065 women per 1,000 men. The number of men under the age of 54 predominates over the number of women. Another interesting point from the current statistics is the age structure of men and women. With the increasing of age there is an emerging tendency of increase of the number and relative share of women. The aging process is more pronounced among women than among men. One of the reasons for this is the higher mortality rate among men and, therefore, the lower life expectancy among them. Last year, the largest number of men was between the ages of 30 and 54, and for women the upper limit increased up to 74 years. Compared to 2019, the largest increase in both genders is in the age group between 45 and 54 years. The largest decline in both, men and women, was reported by the group between 25 and 29 years. The next chart shows the distribution between the different age intervals for both genders:

Source: NSI. Period: 2020

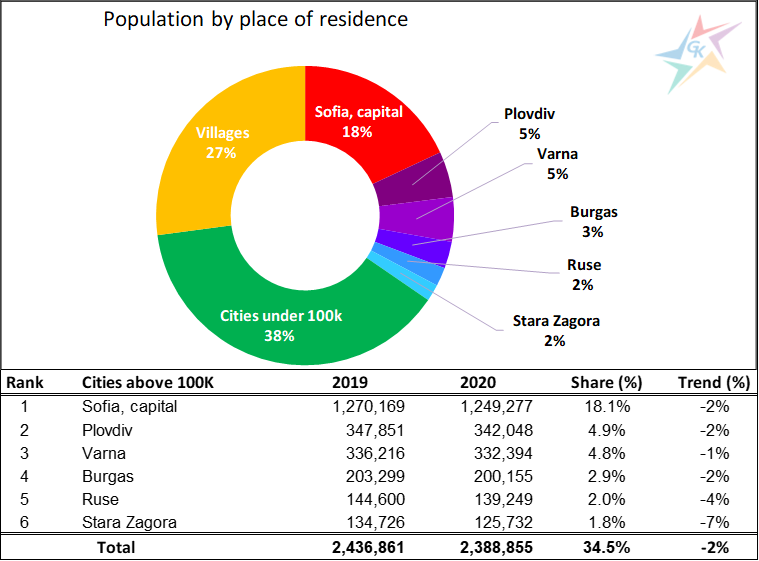
Another demographic feature of our country is the concentration of the population in the cities and depopulation of small settlements. As of 31.12.2020 the number of people living in cities reaches 72.9%, and those in the villages – 27.1%. Six cities in the country – Sofia, Plovdiv, Varna, Burgas, Ruse and Stara Zagora, have a population above 100,000 people and in total represents 35% of the country’s population:

Source: NSI. Period: 2019-2020

It is an interesting fact that in the past year the internal migration in the country increased by 53.9% compared to 2019:

Source: NSI. Period: 2010-2020

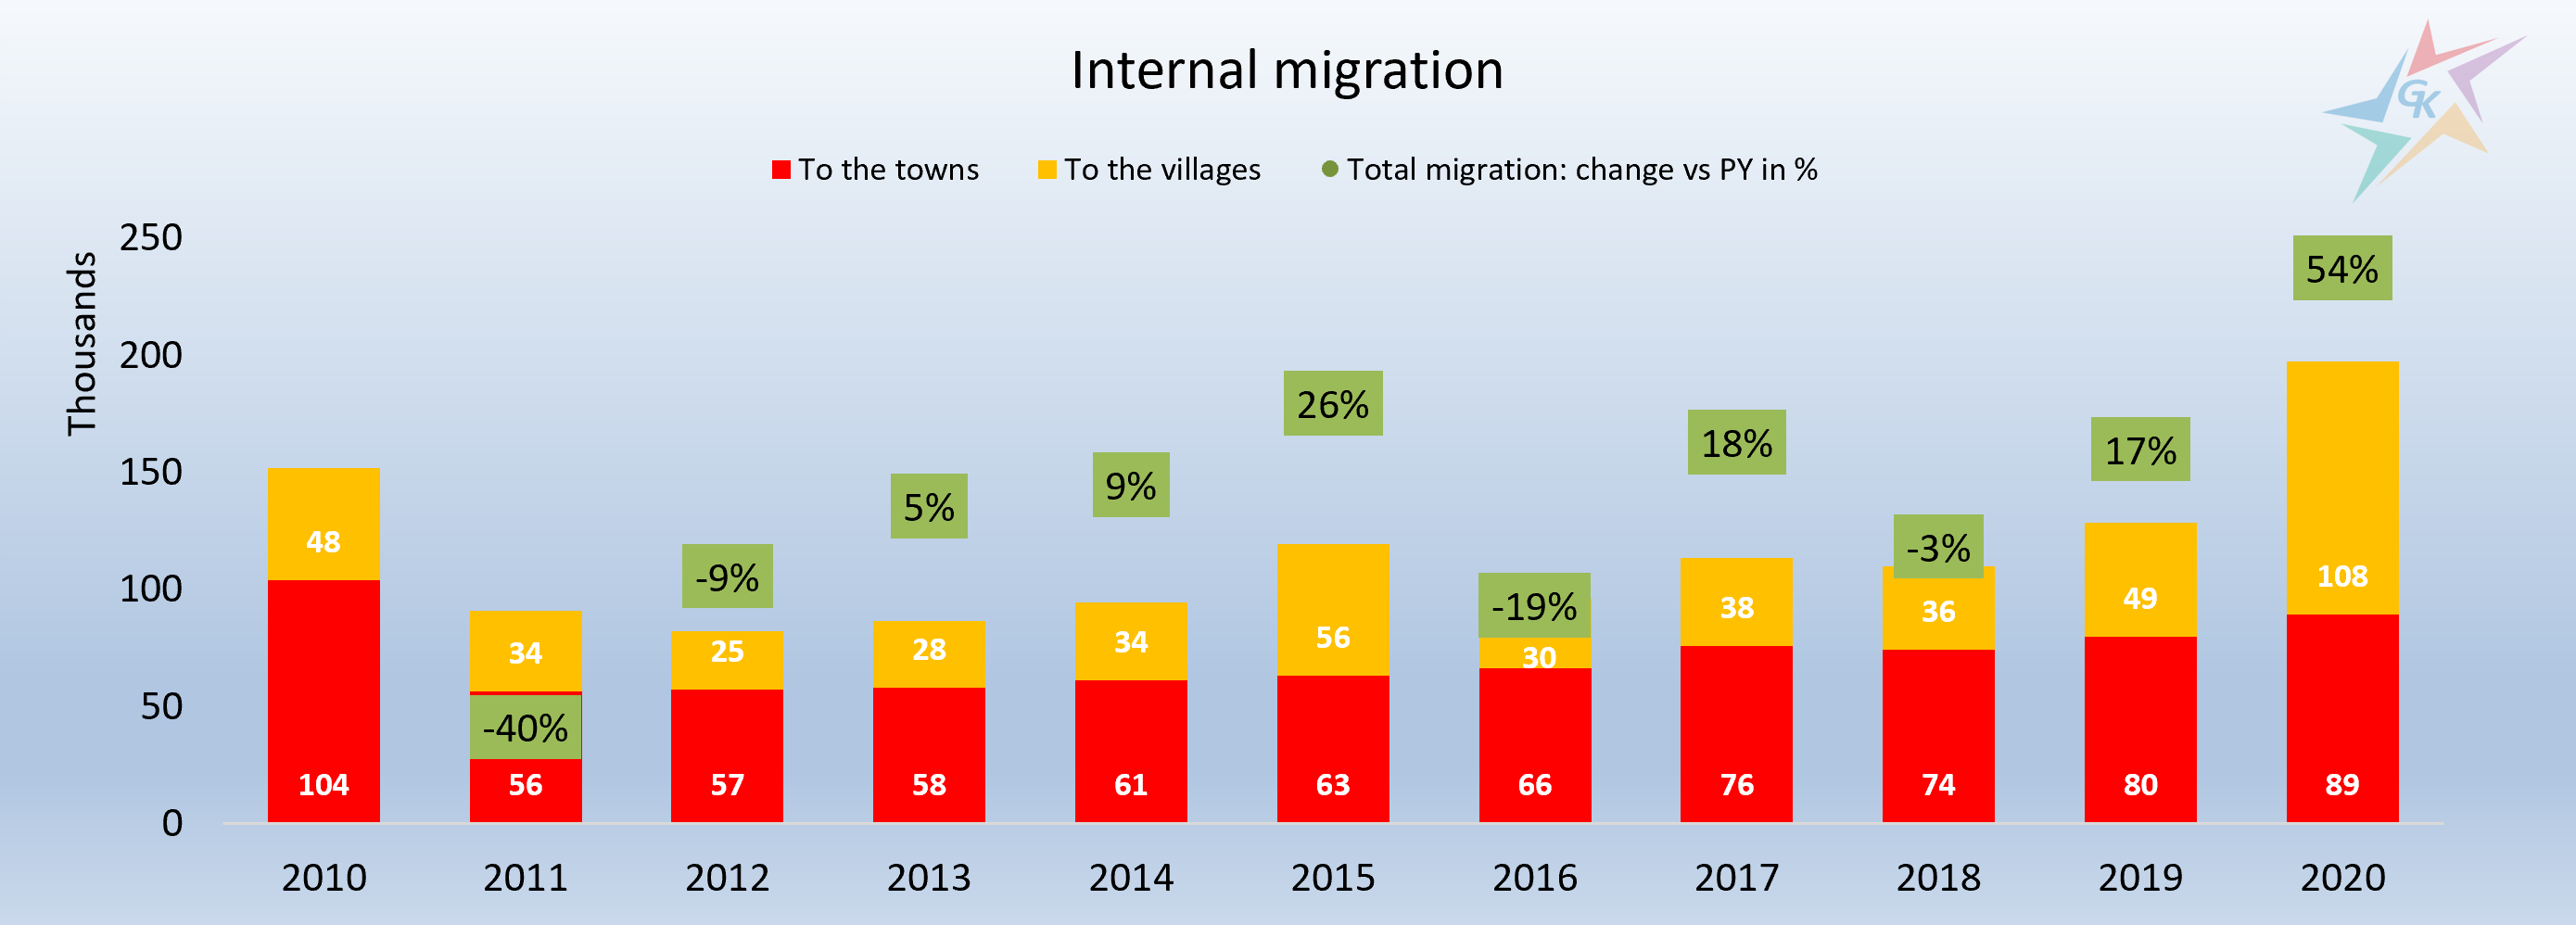
197,242 people have changed the settlement, and more than half of them (108,085 people) have preferred the life of a village to that of the city. This trend is clear from the data in the table above, according to which an average of 2% of the population leave the six largest cities. 2020 is the first year in the last ten years in which there is a greater internal migration towards villages than to the cities. The main reason for this can be found in the appearance of Covid-19 insulation and the ability to work remotely, which the pandemic imposed. The highest migration is in the direction “city – village” (48.4%). This is followed by migration in the direction “city – city” (29.9%) and “village – city” (15.3%). The migration share in the direction “village – village” has the lowest share – 6.4%.

For additional information, please contact our team via the contact form.

The advertising market in TV in the first quarter of 2021 and TOP 5 categories

The past 2020 has gone down in history as the year of Covid-19 and the adaptation to the new reality. The challenges it delivered to us reflected in all sectors. Advertisers faced a new and dynamic environment in which they had to make quick decisions in response to emerging new needs. Rapid adaptation and forecasting of the needs that the new reality will bring were crucial. The initial shock by the introduction of a state of emergency was overcome and with the easing of measures the business adapted and revised its strategies and planned activities. Here is a more detailed analysis of the gross budgets invested in TV and the reported GRPs 30 for the target group all aged between 25 and 54 (A 25-54) in the first quarters of 2020 and 2021:

Source: GARB Audience Measurement Bulgaria. Period: Jan-Mar 2020 and 2021.

In the left part of the chart are the reported gross budgets for TV advertising during the two comparable periods. The data show that the first quarter of 2021 marks a 40% increase in gross investment compared to the same period last year. The right part of the chart presents the achieved levels in weighted GRPs 30. According to this indicator, the results this year are 1% lower than the previous one. Please, note that the weighted GRPs 30 more accurately reflects market dynamics and investment, as gross investment is based on official advertising rate cards before discounts, which in turn outpace inflation and often lead to strong market distortions, especially in smaller niche channels.

Advertisers’ revised strategies have also led to a rearrangement of the categories by which active campaigns are classified. The changes are clearly visible from the table below the graph, in which we present the ranking in the top 5 of the categories based on reported weighted GRPs 30 for target group A 25-54:

Source: GARB Audience Measurement Bulgaria. Period: Jan-Mar 2020 and 2021.

The first 5 categories generate 74% of the total volume of TV advertising.

In both considered periods the leading position is reserved for products from the category “Pharmaceuticals”, which traditionally maintains high levels of activity. In this category we report the highest number of actively competing companies – a total of 65, and the brands that were active in the first quarter of this year are 186. Although there is a decline of about 1%, this is also the category in which are adding new advertisers and new products and maintaining a sustainable share of 30%. The category is formed by 12 subcategories and the first two in the internal ranking – “Food and diet supplements” and “Medicines” form 78% of the total volume in the category “Pharmaceuticals”:

Source: GARB Audience Measurement Bulgaria. Period: Jan-Mar 2020 and 2021.

On second place is the category “Retail outlets”, which increased by 34% in the first quarter of 2021 compared to the same period in 2020. In addition to the traditional chains of grocery stores, black and white appliances and household goods, we also observe the increased presence of a variety of popular online stores – emag.bg and fashiondays.bg (a part of Allegro Group), AboutYou.bg, Vivre.bg, Answer.com, modivo.bg and obuvki.bg (both a part of Eobuwie.pl) and many others. The first subcategory “Chain stores” out of a total of 6 in the segment generates 69% of the volume. “Online stores” reported the highest growth in category compared to last year, but it is important to note that many advertisers from subcategory were “moved” in this segment in early February 2021:

Source: GARB Audience Measurement Bulgaria. Period: Jan-Mar 2020 and 2021.

On third place in the ranking of categories is “Foods” with a 12% share of weighted GRP’s 30. In the first quarter of 2021, the category reported a decline of 17% compared to the same period in 2020. During the analyzed periods, a total of 30 subcategories were active. Products from the subcategory “Dessert bars” are advertised most intensively, and the first three subcategories form only 33% of the total volume:

Source: GARB Audience Measurement Bulgaria. Period: Jan-Mar 2020 and 2021.

Similar to “Pharmaceuticals”, the “Cosmetics” category remains stable with a minimum growth of 1% based on the reported weighted GRPs of 30 and retains the fourth position. It is interesting to note that in this category traditionally the most advertised products such as shampoos and conditioners, oral hygiene products and facial cosmetics are declining, but it is fully compensated by the activation of two passive subcategories in recent years – “Toilets soaps and disinfectants” and “Body cosmetics”, and by growth in the sub-category “Hair dye”. A total of 16 product subcategories were active during the analyzed periods, and the first three represent 55% of the volume of the “Cosmetics” category:

Source: GARB Audience Measurement Bulgaria. Period: Jan-Mar 2020 and 2021.

“Drinks” category is on fifth place. This is one position higher, but in general the reported GRPs 30 decreased by 5% compared to a year earlier. The dynamics in the subcategories is high and is strongly influenced by the opportunity for people to visit restaurants and spend time away from home. “Drinks” category consists of 12 subcategories. The “Beer” subcategory is undisputed leader, followed by “Carbonated Soft Drinks” and “Instant Coffee”. The three leading categories account for 73% of the total volume:

Source: GARB Audience Measurement Bulgaria. Period: Jan-Mar 2020 and 2021.

In the first quarter of 2021, all other categories accumulate 26% of the total market volume based on weighted GRPs 30 indicator and reported a decrease of 6% compared to the same period a year earlier. In the category “Others” we have summarized the data for the rest 19 categories, which are including 82 subcategories.

For additional information, please contact our team via the contact form.

Which TV channel did we choose to watch on election day?

The election day has always enjoyed high audience interest, both from active voters and from people who do not go to the ballot box. This spring, the parliamentary elections challenged leading television stations to compete in a battle for viewers throughout Sunday. Interactive studios, discussions with popular guests, political scientists, sociologists and a strong presence of the presenters were among the main means by which the national televisions tried to attract the audience. To the three big televisions we added 7/8 TV station. To find out which of them did best, we present a chart with data on the achieved ratings by hours among the population of the country over 18 years of age:

Source: GARB Audience Measurement Bulgaria. Period: 04.04.2021

From the early hours of the morning, the televisions followed the course of election day. The graph shows that the content of the information blocks of bTV and Nova TV was the most preferred. In the earlier hours between 07:00 and 10:00 bTV leads with a slight advantage over its main competitor, but in the hours before noon, between 10:00 and 12:00 o’clock, Nova TV turns out to be the most watched. “The day begins with Georgi Lyubenov” on BNT 1 gradually attracts the audience and manages to keep it between 09:00 and 12:00. With a “jump” in the rating, the bTV news program turned out to be the most preferred among the viewers with the right to vote. Although the channel continues with up-to-date information every hour, between 13:00 and 17:00 o’clock it loses its audience, which transferred to competitive TV channels. In the afternoon, the interest in the development of the elections increased and led to an increase in the viewership of 7/8 TV, which from 12:30 o’clock began to broadcast live commentary studio. The special election program of bTV with hosts Anton Hekimyan and Svetoslav Ivanov won convincingly in the evening between 17:00 and 22:00 o’clock. It is interesting to note that after 22:00 o’clock BNT 1 reaches its highest rating for the day and wins the audience. After 23:00 all televisions start gradually losing viewers’ attention.

To give a more complete picture of the preference of the different target groups during the election day, we prepared additional charts. The more curious of you can see them in the gallery:

For additional information, please contact our team via the contact form.

How does the time we spend watching TV change?

In the previous article, our team presented in detail the change in the time we spend in front of TV during the various stages of isolation on weekly basis. The main conclusion we have reached is that television is becoming an increasingly common choice for entertainment by people. The average daily time that the entire population of the country at age 4+ spends on watching TV in 2020 increases by 9% or above 22 minutes compared to 2019.

In this article, we answer the question of how this “extra” time for television is distributed during different day parts. To reach it, we compared the rating data in the target group All 4+ by hours in average for 2019 and for 2020:

Source: GARB Audience Measurement Bulgaria. Period: 01.01.2019-31.12.2020

The chart shows that all time zones in 2020 report a higher rating compared to 2019. The normal dynamic day of workers and students begins in the early hours of the day, when the first information blocks of the leading televisions start. This trend has changed in the past year. The serious increase in viewership starts at 8 o’clock in the morning and continues throughout the day. This is completely logical, given that isolation has left us at home and leads to higher levels of television watching during the hours we are traditionally out of home. The rating of the television program during the active part of the day between 6 a.m. and 6 p.m. increases by 12%. In the prime-time slot, the hours between 6 p.m. and midnight, this percentage drops to 5%, but it remains the most watched time, respectively with the highest rating. High growth is marked in the hours after midnight, in which people continue to find interesting content to watch. The reported data show that the average rating grows by an average of 13% between midnight and 6 a.m. The explanation of this is the different rhythm that follows the daily life of people in isolation. The distance from the outside world and the long stay at home make us merge the hours of work and rest and sharpen our desire to be constantly “involved” for the changes taking place outside.

The pandemic, the limited opportunities for entertainment outside the home and the work from home lead not only to a longer stay in front of TV, but also to more people, who spend their time in front of TV screens. To track the extent to which television wins different target groups at different day parts, we present to your attention the following chart:

Source: GARB Audience Measurement Bulgaria. Period: 01.01.2019-31.12.2020

We analyzed the audiences by main characteristics such as gender, type of settlement and economic activity. To understand the change in TV consumption in different parts of the day, we compared the rating achieved by each group in the specific time slot in 2020 vs 2019.

As it has already become clear, the daytime zone marks a high increase in viewership, especially among the people who are kept at home by the pandemic – the economically active part of the population. This circumstance strongly affects the people living in the capital and to a lesser extent those living in the countryside.

The TV program during the daytime is considered more interesting by the female audience, where the achieved rating grows by 13%.

The hours in prime-time, between 6 p.m. and midnight, traditionally enjoy the highest rating among the audience. Also, in this time zone the results in the group of the economically active have the highest growth – 8%. The tendency is kept for the people from Sofia, but also for the audience from the villages, who find more interesting content in prime-time in 2020 compared to 2019. The shows in this time zone turn out to be more liked by the ladies than the men.

The small hours of the day are often overlooked because people are already saturated by information content. In 2020, this statement is questioned by the figures, which show high increase of the rating in the hours after midnight. The group of the economically active population achieves the highest results, in contrast to the economically inactive, whose rating is also growing, but within more moderate range. The imposed isolation has the strongest influence on the people from the capital, who prolong their TV day to the greatest extent. It is interesting to note that this time zone leads to the higher interest among the male audience compared to women. If the program during the active part of the day is preferred by the ladies, then the after midnights shows attract the most men and in their group the rating grows by 14% in average.

For additional information, please contact our team via the contact form.

How does the time we spend watching TV change?

Over the past year, our society has been confronted with the Covid-19 virus. With the announcement of the first cases of the contagious disease in the country, a variety changes in people’s daily lives began. Wearing protective equipment, constant disinfection and social distance have taken root in our lives. The time spent in the office or with friends outside was replaced by home isolation. And if in the beginning the attitude was that strict measures for a certain period will stop the spread of the disease, then over time we realized that we must continue our lives with the presence of the virus among us. This is reflected in all aspects of our daily routine. One of the first changes we noticed was in consumer habits and media consumption. The hours spent at home have increased, and this has contributed to the increase in the time we spend in front of the screens of mobile devices, computers and TVs. To get a quantitative idea, we compared the average daily TV viewing time by weeks for 2019, 2020 and 2021 as of March 28:

Source: GARB Audience Measurement Bulgaria. Period: 01.01.2019-28.03.2021

The data in the chart are for the target group All 4+ (the entire population of the country at 4+ years old). In the first weeks of 2020, the average duration of watching television is close to the values from the previous year.

In the beginning of March, information about the spread of Covid-19 took over the world news and from the 10th week the interest towards television content began to grow.

The 11th week is marked by the official announcement of the first “lockdown” in Bulgaria and by the constant emergency broadcasts with information about what is happening in the country. News blocks become an integral part of television content for everyone. The desire for information continues to grow strongly for a few more weeks, until the moment when the viewer’s attention is saturated and a more moderate growth rate follows compared to 2019.

Although the situation with the spread of the virus seemed to be under control during the summer months, many people are cautious and continue to spend more time at home. This is clear from the chart in which we see constant growth, compared to the summer months of 2019.

The launch of autumn TV formats brings the audience back to the TV screens. The traditional growth in viewership is also influenced by the deteriorating situation related to Covid-19 in the country, which leaves students and a large part of the workers at home again.

The ensuing second lockdown also led to an expected increase in time spent in front of TVs, but this time in a more moderate range. The first weeks of December coincide with the strictest measures imposed in the country, as well as with the final episodes of the popular TV formats. It is clear from the chart that the combination retains the viewer’s attention and the growth achieved on a weekly basis is among the highest since the announcement of the first “lockdown”.

It is important to note that in 2020 the average daily duration of watching TV by the target group All 4+ increases by 9% compared to 2019 and reaches a little over 271 minutes on average per day (more than 4 and a half hours).

The described trend is in line with the world tendency, according to which the time spent by viewers in front of TV screens is slowly and gradually increasing, but the appearance of Covid-19 and the isolation imposed by the virus also have a strong influence on the increase on an annual basis. The growth trend continues in the beginning of 2021 as well. Although the weeks surrounding the announcement of the third lockdown on March 22, 2021, did not mark last year’s picks, the audience continue to spend more time on watching TV – 16% more, compared to the same period, a year before Covid-19.

For additional information, please contact our team via the contact form.

The return of the Bulgarian series

This year began with a request for an ambitious spring program from both leading televisions, bTV and Nova. Along with the popular show programs and series, the native production found a place in the battle for viewer’s interest. The long-awaited premieres of “Sunny Beach”, “Scars” and “Missing PD” joined the already familiar titles “Stolen Life”, “All Inclusive”.

Тo get a clearer idea of whether the Bulgarian viewer’s interest in them has resumed and what is the profile of the audience of each of them, we followed the reported ratings of their pilot episodes in several target groups, united by different characteristics – age, location and gender. First, we offer you a visualization of the reported ratings by age groups:

Source: GARB Audience Measurement Bulgaria. Period: 22.02-05.03.2021

The chart shows that the youngest audience under the age of 18 has the highest rating of the entertainment series “All Inclusive” and “Sunny Beach”, followed by the crime saga “Brothers”. The other series managed to attract half as many viewers under 18 years of age.

In the group of the economically active population A 18-49 the predominance is for the series broadcast by Nova. All four series achieve higher results than bTV’s competing productions. It is worth mentioning that in this age group the series “All Inclusive” is a favorite and is one of the two titles, which achieves better results in the active group A 18-49, compared to the group of adults A 50+. The second title is “Brothers”, achieving a 31% higher rating among A 18-49 compared to the A 50+ group.

Traditionally, adults spend more time in front of TV. That is why the rating among them is higher than those in youth and active age. The chart clearly shows that among viewers over the age of 50, the new family drama “Scars” on bTV enjoys the highest results with a reported rating of 13.5%. The second favorite title among them is Nova’s comedy “All Inclusive”.

Another factor whose influence we consider in the analysis is the type of settlement – Sofia, towns and villages:

Source: GARB Audience Measurement Bulgaria. Period: 22.02-05.03.2021

Residents of the capital show the greatest preference for the pilot episodes of “Brothers” and “All Inclusive”, whose previous seasons have obviously ignited and retained viewership. Among the urban audience, Nova’s two series, „Stolen Life“ and „All Inclusive“ are leaders, but they are also time-tested productions with several seasons each. They are immediately followed by both bTV series – “Sunny Beach” and “Scars”. The two bTV productions are premieres and obviously their launch was eagerly awaited. People from the villages are split between Nova’s comedy “All Inclusive” and the new family drama on bTV – “Scars”.

To complete the overview of the Bulgarian series, we present you a visualization of the results for men and women:

Source: GARB Audience Measurement Bulgaria. Period: 22.02-05.03.2021

Traditionally, women’s interest in television productions is more pronounced and they are more ardent fans of the series. It is clear from the chart, in which all the series in question enjoy a higher rating among women compared to men. And here the leader in both audiences is the pilot episode of the third season of “All Inclusive”. It is interesting to note that the productions of bTV enjoy significantly higher results in the female audience than the male – the average rating for women is 26% higher.

For additional information, please contact our team via the contact form.

What are we going to watch tonight?

All entertainment formats have already started. Televisions broadcast at least one episode. The “battle” for the audience’s interest in every day of the week is at stake. We tried to systematize the information by days of the week and by channels and to present the results. In the new spring season, 11 shows are fighting for the attention of the viewers in prime time. With a total of four shows, Nova is the leader with a presence in six days of the week with “Your face sounds familiar”, “Power couple”, “Kitchen nightmares” and “Rachkov’s forbidden show”. bTV relies on three shows in four days of the week – “MasterChef”, “The Comedians and friends” and “Bulgaria’s got talent”. BNT 1 does not have the potential of commercial television and is positioned in the battle for viewers with a single show “Saturday night with Mitko Pavlov”, but instead does it quite well, choosing a day when there is no competition in the segment of entertainment programs. We have excluded ” Nikolaus Citiridis’ Show” on bTV from the analysis because it is broadcast every weekday in the late prime of the media.

First, we present the average ratings of the shows in three age groups – children and adolescents up to 17 years (A 4-17), the audience of active and dynamic people aged between 18 and 49 (A 18-49) and the audience of adults over 50 years of age (A 50+):

Source: GARB Audience Measurement Bulgaria. Period: 6.02.2020-7.03.2021

On Tuesdays, Wednesdays and Sundays Nova and bTV are in direct confrontation for the viewer’s attention. Nova wins the trust of an active and dynamic audience, while bTV is the leader among the more mature part. On Sunday, the results of the two private televisions among people between the ages of 18 and 49 are very close.

The second graph shows the average ratings of the shows by gender:

Source: GARB Audience Measurement Bulgaria. Period: 6.02.2020-7.03.2021

The data show that in the days of a direct confrontation bTV won the attention of the female audience, and on Sunday, both men and women prefer “Bulgaria’s got talent” to “Rachkov’s forbidden show”.

With the last graph we present you the achieved average ratings among the audience, based on the place of living:

Source: GARB Audience Measurement Bulgaria. Period: 6.02.2020-7.03.2021

On Tuesday and Wednesday the competition for the urban audience outside Sofia is equal, at the expense of the viewers in the villages, where again bTV wins and manages to attract 20% more viewers. On Sunday, the undisputed winner among the audience in Sofia is Nova, attracting 47% more viewers, but bTV with “Bulgaria’s got talent” managed to gain the attention of the rest of the TV audience and leads Nova.

For additional information, please contact our team via the contact form.

Average rating of the central News programs of the three main televisions

In today’s article we will briefly present the viewership of the central News programs of the three main TV channels – BNT 1, bTV and Nova.

Central evening News is traditionally one of the most watched and preferred programs and is a magnet for retaining and attracting audiences.

The chart below presents the average monthly rating of prime time News of the three main televisions for the period January 2020-February 2021:

Source: GARB Audience Measurement Bulgaria. Period: 1.01.2020-28.02.2021

The sharp rise in interest in the News after the announcement of a state of emergency on March 13, 2020 is very clear. The rating of the central News of BNT 1 increased by 27% compared to the previous month, while on Nova the rating growth was 15%, and on bTV respectively 7%. March 2020 is also the last month in which bTV unconditionally dominates its main competitor – Nova. Despite the pandemic and the state of emergency, Nova continued to broadcast the already filmed episodes of the Bulgarian series, as well as all the entertainment programs, unlike bTV, which postponed the premieres for a future period and bet on reruns. This decision helped Nova central News to take the lead. The beginning of 2021 is difficult for bTV, which starts with a nearly 20% lower rating compared to January 2020. There is no significant change on Nova, but on the other hand BNT 1 can boast of about 25% rating growth in the first two months compared to the same periods in 2020.

In the following chart we consider two age groups – A 18-49 and A 25-54, expanding the analysis and adding the average rating for men and women within these groups:

Source: GARB Audience Measurement Bulgaria. Period: 1.01.2020-28.02.2021

The female audiences F 18-49 and F 25-54 have the highest rating in bTV and Nova. In Nova this preference is much stronger and the difference in the rating of the two age groups between men and women is about 20% in favor of women, while in bTV this difference is only 6%.

It is more interesting to note that the central News of BNT 1 attracts more attention of men than women and this is a significant difference of the state TV station compared to the commercial bTV and Nova.

Another interesting point in the analysis is the dynamics of the ratings of the central News during the different week days in the considered TV channels. In this analysis, we focused on the audience A 18-49, which is also perceived as a benchmark and is most often used by commercial television to present the achieved results:

Source: GARB Audience Measurement Bulgaria. Period: 1.01.2020-28.02.2021

The interest in the central News programs is stronger on weekdays, compared to the weekends. The highest number of spectators is on Monday, and by the end of the working week they are gradually decreasing. From the weekends, Sunday is the most preferred by the audience for watching central News programs. Saturday is the day when viewers traditionally indulge in entertainment and less engaging TV content and the audience is least interested in News. The drop in the rating on Saturday compared to Monday is 20% for Nova, 16% for bTV and 12% for BNT 1, respectively.

The average data for the analyzed period also show that throughout the week on average Nova dominates over bTV, except for Sunday, when the prime time News of bTV attracts slightly more viewers and is most preferred among the analyzed audience A 18- 49. As with the commercial bTV and Nova, the central News program of BNT 1 on weekdays attracts more viewers, and the interesting thing is that the strongest day is Tuesday, followed by Wednesday, and Monday is on third place in terms of rating. On Saturday and Sunday the ratings of the central News of BNT 1 are very close.

For additional information, please contact our team via the contact form.

How much do guests “cost” to advertisers?

Since the beginning of the year, NBG and TSH have resumed reporting of added guests audience in the ratings of TV channels. The other TV groups have so far refrained from introducing this reporting methodology. The practice is not new to the market, but with the transfer of all televisions to a single metric since May 1, 2020, this functionality needed improvement and was postponed. Its purpose is to give us information about how big the added guests audience is and what percentage on top to the standard audience (life + timeshifted) the advertisers pay.

Over the years, everyday life becomes more dynamic, free time, especially in larger cities, becomes more and more insufficient. The last 12 months have been marked by more restrictions in connection with the COVOD-19 pandemic. It was interesting for us to analyze the percentage of the added guests TV audience. For the specific analysis, we focused on the audience all aged 18 to 49, which is a benchmark target group for our market. We merged the TV channels according to the groups to which they belong or represent them and first we looked for dependence by dividing the day into time segments:

Source: GARB Audience Measurement Bulgaria. Period: 01.01.-28.02.2021

The summary data for all TVs (TOTAL TV) seem logical – before noon and after midnight the guests who watch TV are few and the added audience is in the range 0.23% ÷ 0.29%. This additional audience increases in the afternoon and especially in the hours after 19:00 till midnight. At the same time, the data by TV groups reveal a different picture. Most of the guests watching TV are scattered among the variety of small niche channels and this is typical for all hours of the day. At BNT TV Group, it is surprising to see that the largest share of the audience added by guests was reported after midnight. For BMG and NBG TV groups, the data appear to be balanced within the analyzed time segments, but this is to be expected, as the two TV groups have about a 75% share in target group A 18-49. It is also clear that the added audience of “guests” aged 18 to 49 in the BMG group is more than NBG.

We were curious if the “guests” prefer certain days of the week and here is what the summarized data by TV groups show:

Source: GARB Audience Measurement Bulgaria. Period: 01.01.-28.02.2021

In summary for all televisions, the least “guests” are added to the traditional audience on Wednesdays, and the most on Saturdays. This data filter also shows the “pronounced” interest of the guests in the smaller niche channels. This is quite normal given the fact that these channels offer less engaging content, predetermining the ability of the audience to “split” their attention between the interlocutors in the company and the TV screen. It is noteworthy that BNT is again different from all the others – the audience added by guests in this group is the largest on Thursday, as much as 0.56%. BMG again reports higher percentages of added guests audience compared to NBG in every day of the week.

As the data by TV groups are summarized, we decided to pay attention to the three main televisions in the country (BNT 1, bTV and Nova), that are attracting the largest audience. Also, in this analysis we visualized the data first by time segments:

Source: GARB Audience Measurement Bulgaria. Period: 01.01.-28.02.2021

We also added a visualization of the data by days of the week:

Source: GARB Audience Measurement Bulgaria. Period: 01.01.-28.02.2021

The observations on the three main channels overlap with the conclusions we stated above in the summaries by the TV groups.

For all who are curious to see more and interpret the data independently, we provide additional visualizations in the gallery. Some of the charts will certainly cause confusion and suppose difficult to explain dynamics in the preferences of guests and hosts.

For additional information, please contact our team via the contact form.

A new seventh season of “Bulgaria’s got talent” started on 28th February on bTV.

One more entertainment show started over the weekend – “Bulgaria’s got talent”. The format was missing from bTV last year, but its return is promising. The show has a new host behind the scenes – the popular vlogger Chris Zahariev. Chris will supplement twice a week the online episodes of the rubric “More from Bulgaria’s got talent” with  moments from the show that were not broadcast on bTV. Here is what the ratings reported by GARB show:

Source: GARB Audience Measurement Bulgaria. Period: 01.03.2010-28.02.2021

Nearly 17% rating at the start of the new 7th season of the show grab the attention of over 46% of all viewers aged 18 to 49 and make it the undisputed leader among TV viewers in this time segment:

Source: GARB Audience Measurement Bulgaria. Period: 28.02.2021

The first episode gives a strong demand among all target groups, but it is also the show that reported the highest rating among the audience A 18-49 in calendar week 8, 22-28 February. Only the pilot episodes of the first and second seasons have achieved higher ratings. We will follow the development of the show and share with you interesting data from the upcoming events of the talents.

For additional information, please contact our team via the contact form.