
The past 2020 has gone down in history as the year of Covid-19 and the adaptation to the new reality. The challenges it delivered to us reflected in all sectors. Advertisers faced a new and dynamic environment in which they had to make quick decisions in response to emerging new needs. Rapid adaptation and forecasting of the needs that the new reality will bring were crucial. The initial shock by the introduction of a state of emergency was overcome and with the easing of measures the business adapted and revised its strategies and planned activities. Here is a more detailed analysis of the gross budgets invested in TV and the reported GRPs 30 for the target group all aged between 25 and 54 (A 25-54) in the first quarters of 2020 and 2021:
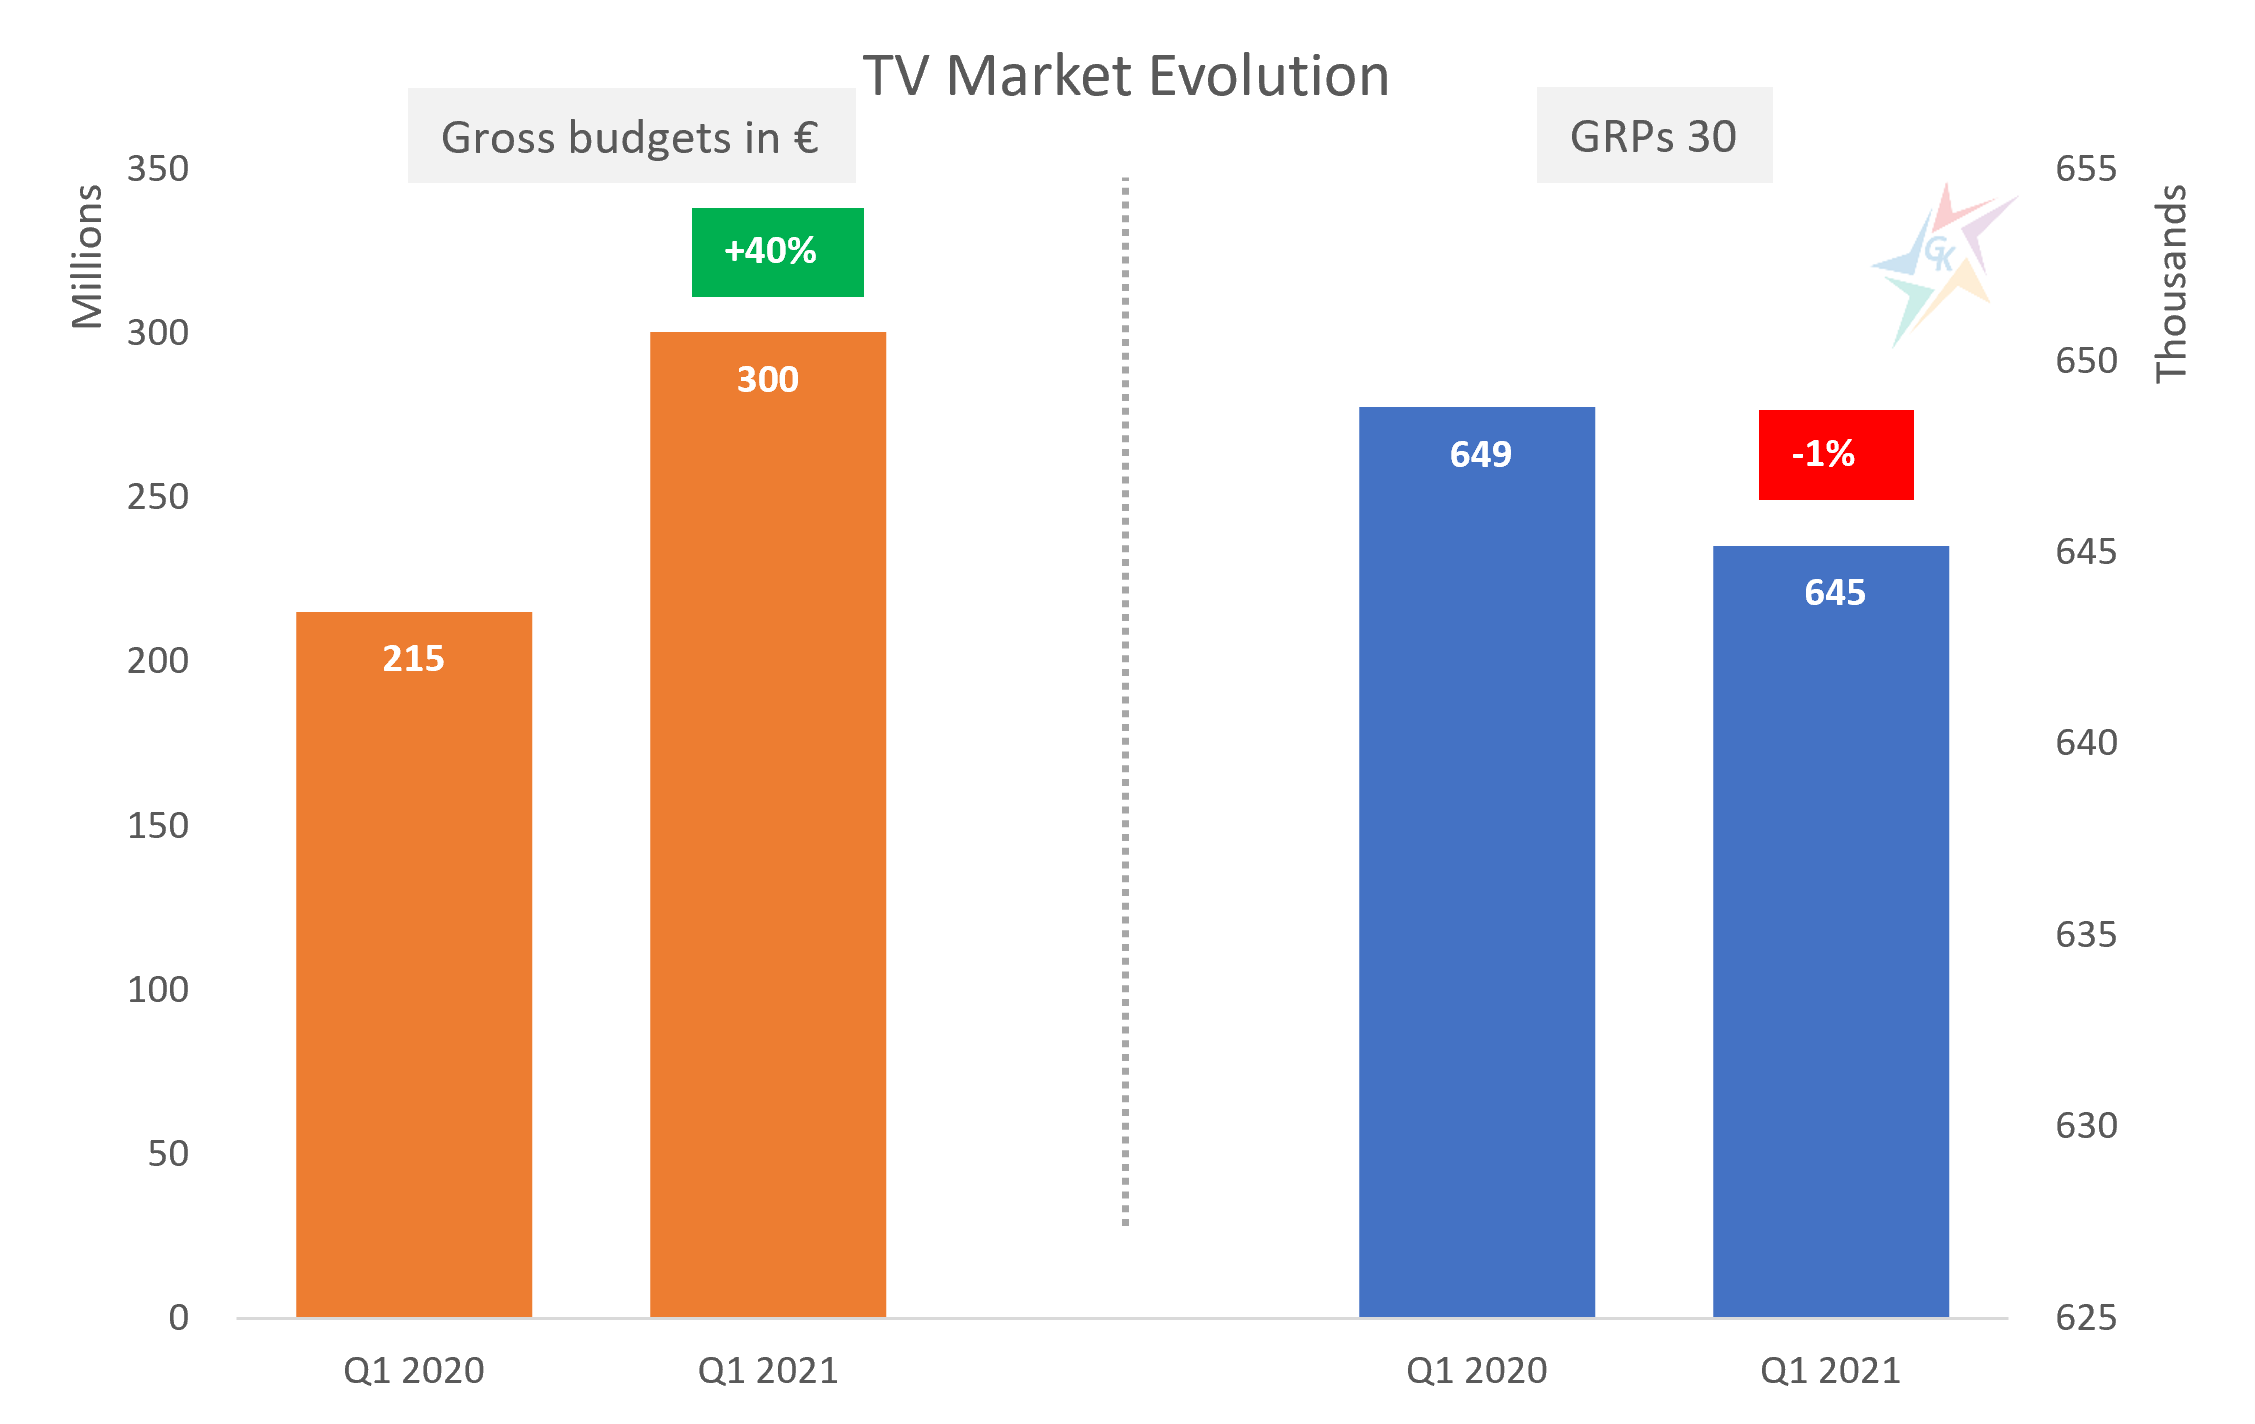
In the left part of the chart are the reported gross budgets for TV advertising during the two comparable periods. The data show that the first quarter of 2021 marks a 40% increase in gross investment compared to the same period last year. The right part of the chart presents the achieved levels in weighted GRPs 30. According to this indicator, the results this year are 1% lower than the previous one. Please, note that the weighted GRPs 30 more accurately reflects market dynamics and investment, as gross investment is based on official advertising rate cards before discounts, which in turn outpace inflation and often lead to strong market distortions, especially in smaller niche channels.
Advertisers’ revised strategies have also led to a rearrangement of the categories by which active campaigns are classified. The changes are clearly visible from the table below the graph, in which we present the ranking in the top 5 of the categories based on reported weighted GRPs 30 for target group A 25-54:
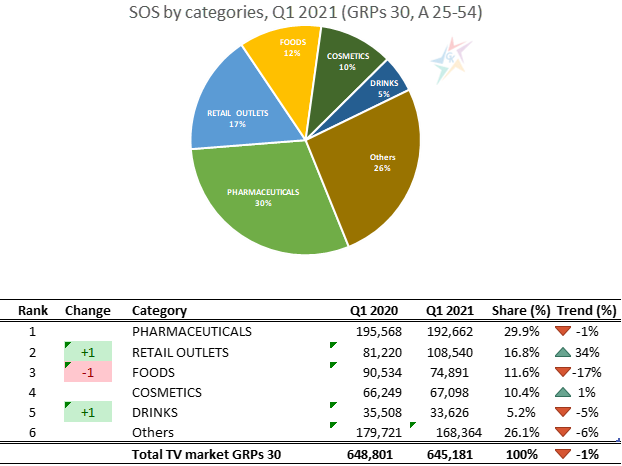
The first 5 categories generate 74% of the total volume of TV advertising.
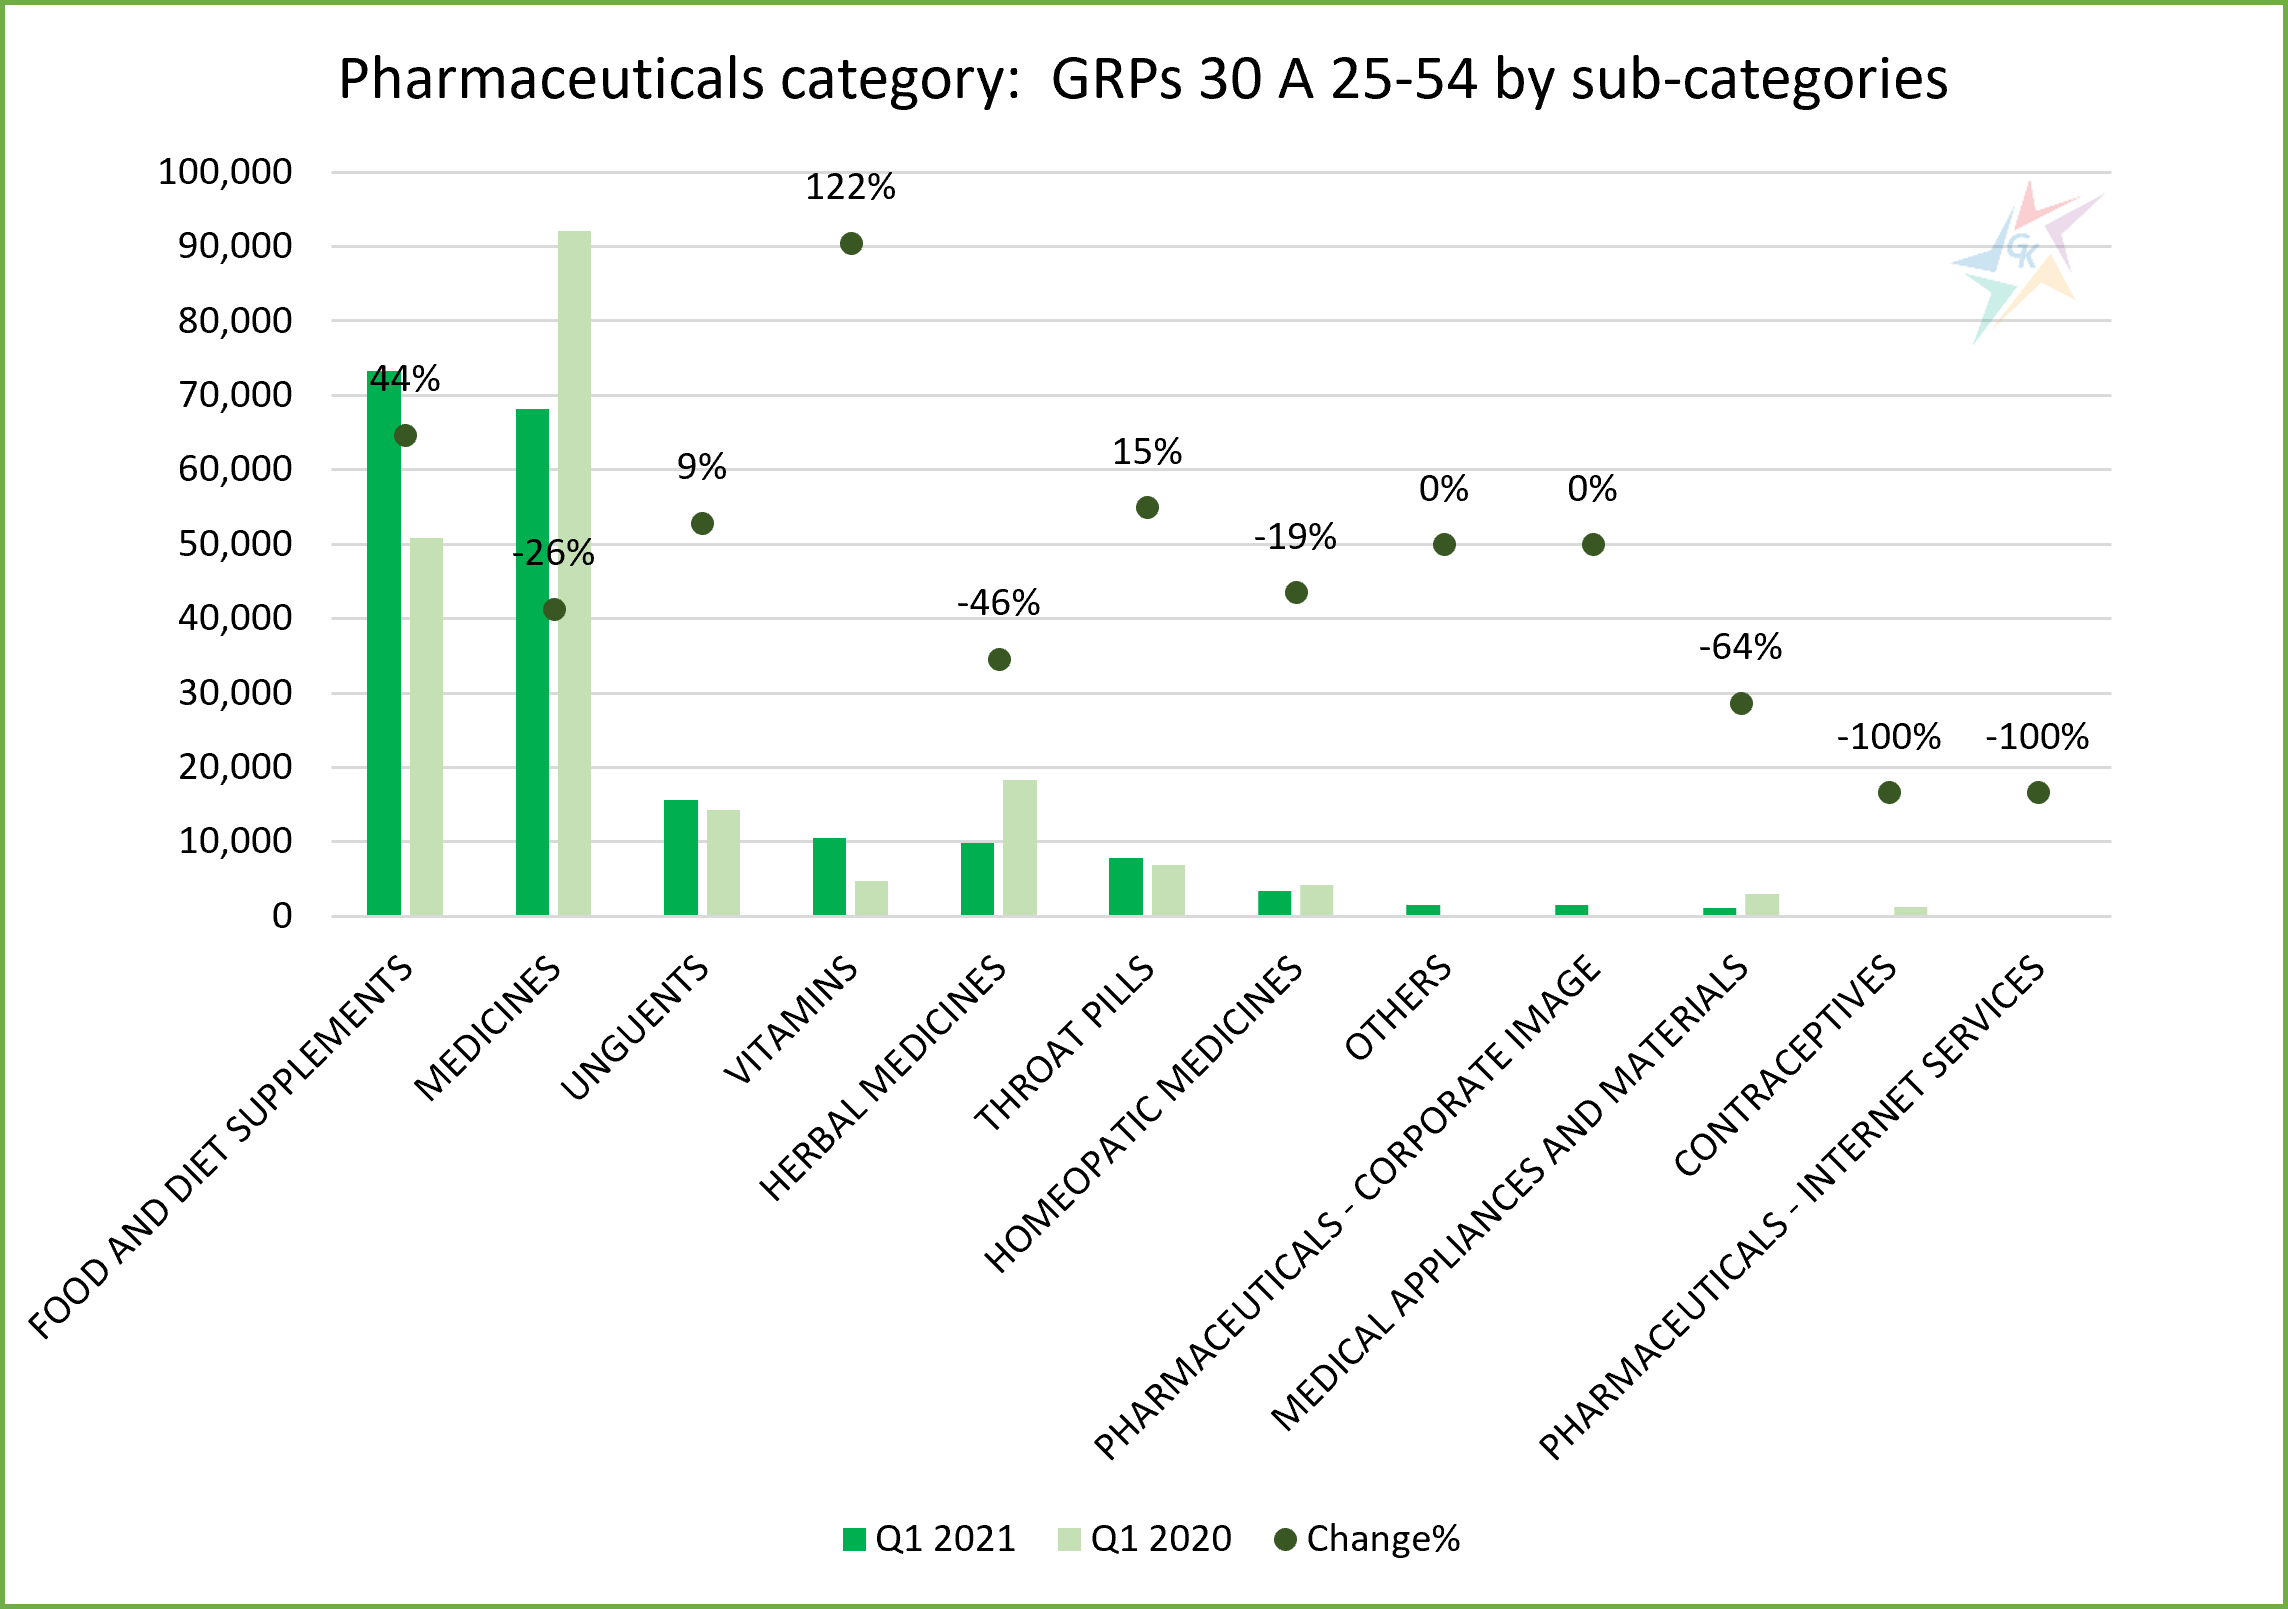
In both considered periods the leading position is reserved for products from the category “Pharmaceuticals”, which traditionally maintains high levels of activity. In this category we report the highest number of actively competing companies – a total of 65, and the brands that were active in the first quarter of this year are 186. Although there is a decline of about 1%, this is also the category in which are adding new advertisers and new products and maintaining a sustainable share of 30%. The category is formed by 12 subcategories and the first two in the internal ranking – “Food and diet supplements” and “Medicines” form 78% of the total volume in the category “Pharmaceuticals”:
On second place is the category “Retail outlets”, which increased by 34% in the first quarter of 2021 compared to the same period in 2020. In addition to the traditional chains of grocery stores, black and white appliances and household goods, we also observe the increased presence of a variety of popular online stores – emag.bg and fashiondays.bg (a part of Allegro Group), AboutYou.bg, Vivre.bg, Answer.com, modivo.bg and obuvki.bg (both a part of Eobuwie.pl) and many others. The first subcategory “Chain stores” out of a total of 6 in the segment generates 69% of the volume. “Online stores” reported the highest growth in category compared to last year, but it is important to note that many advertisers from subcategory were “moved” in this segment in early February 2021:

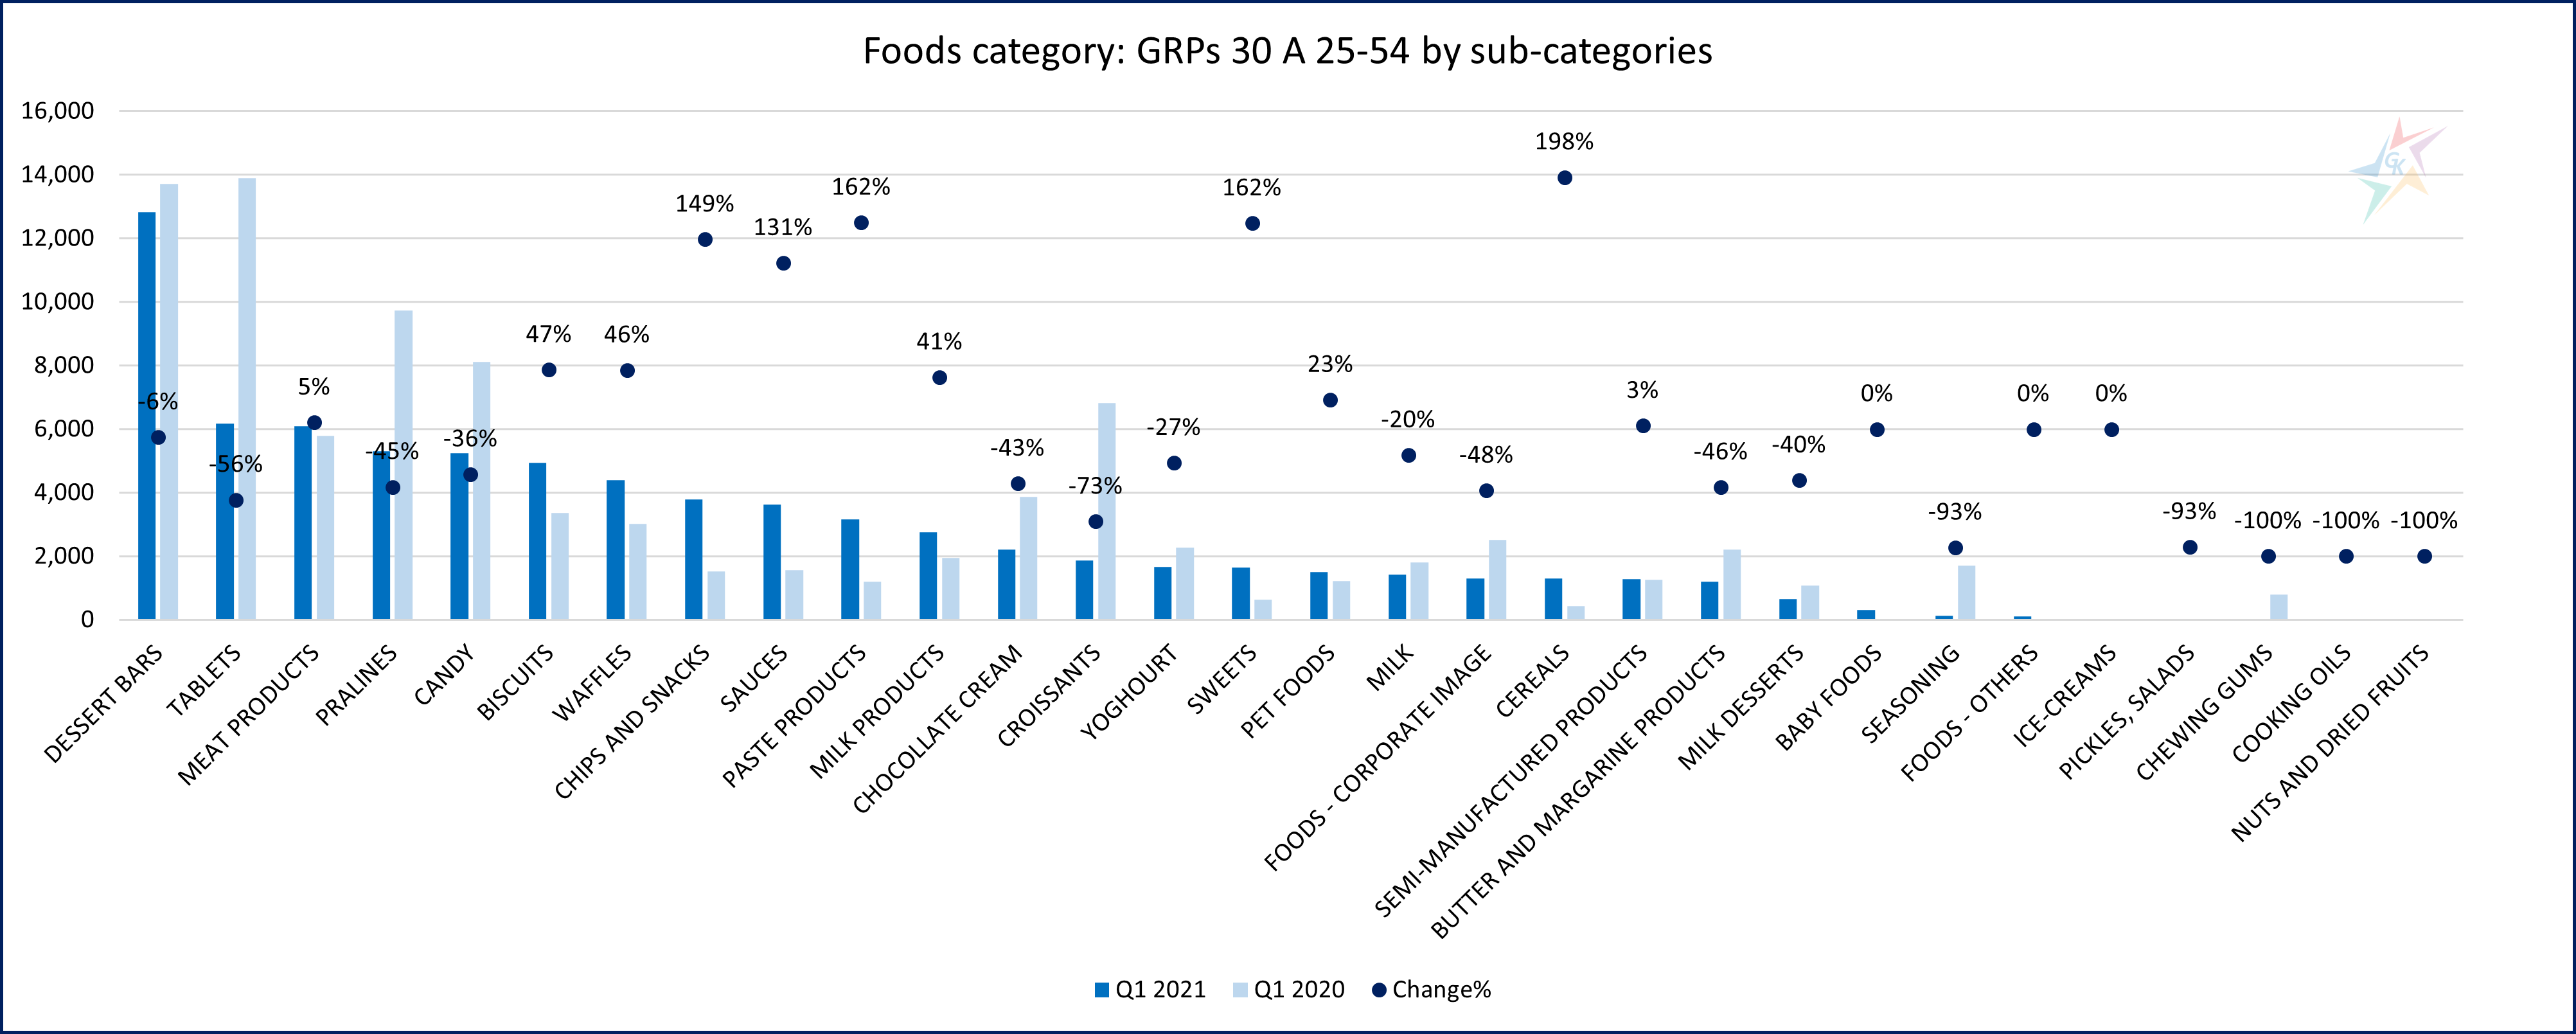
On third place in the ranking of categories is “Foods” with a 12% share of weighted GRP’s 30. In the first quarter of 2021, the category reported a decline of 17% compared to the same period in 2020. During the analyzed periods, a total of 30 subcategories were active. Products from the subcategory “Dessert bars” are advertised most intensively, and the first three subcategories form only 33% of the total volume:
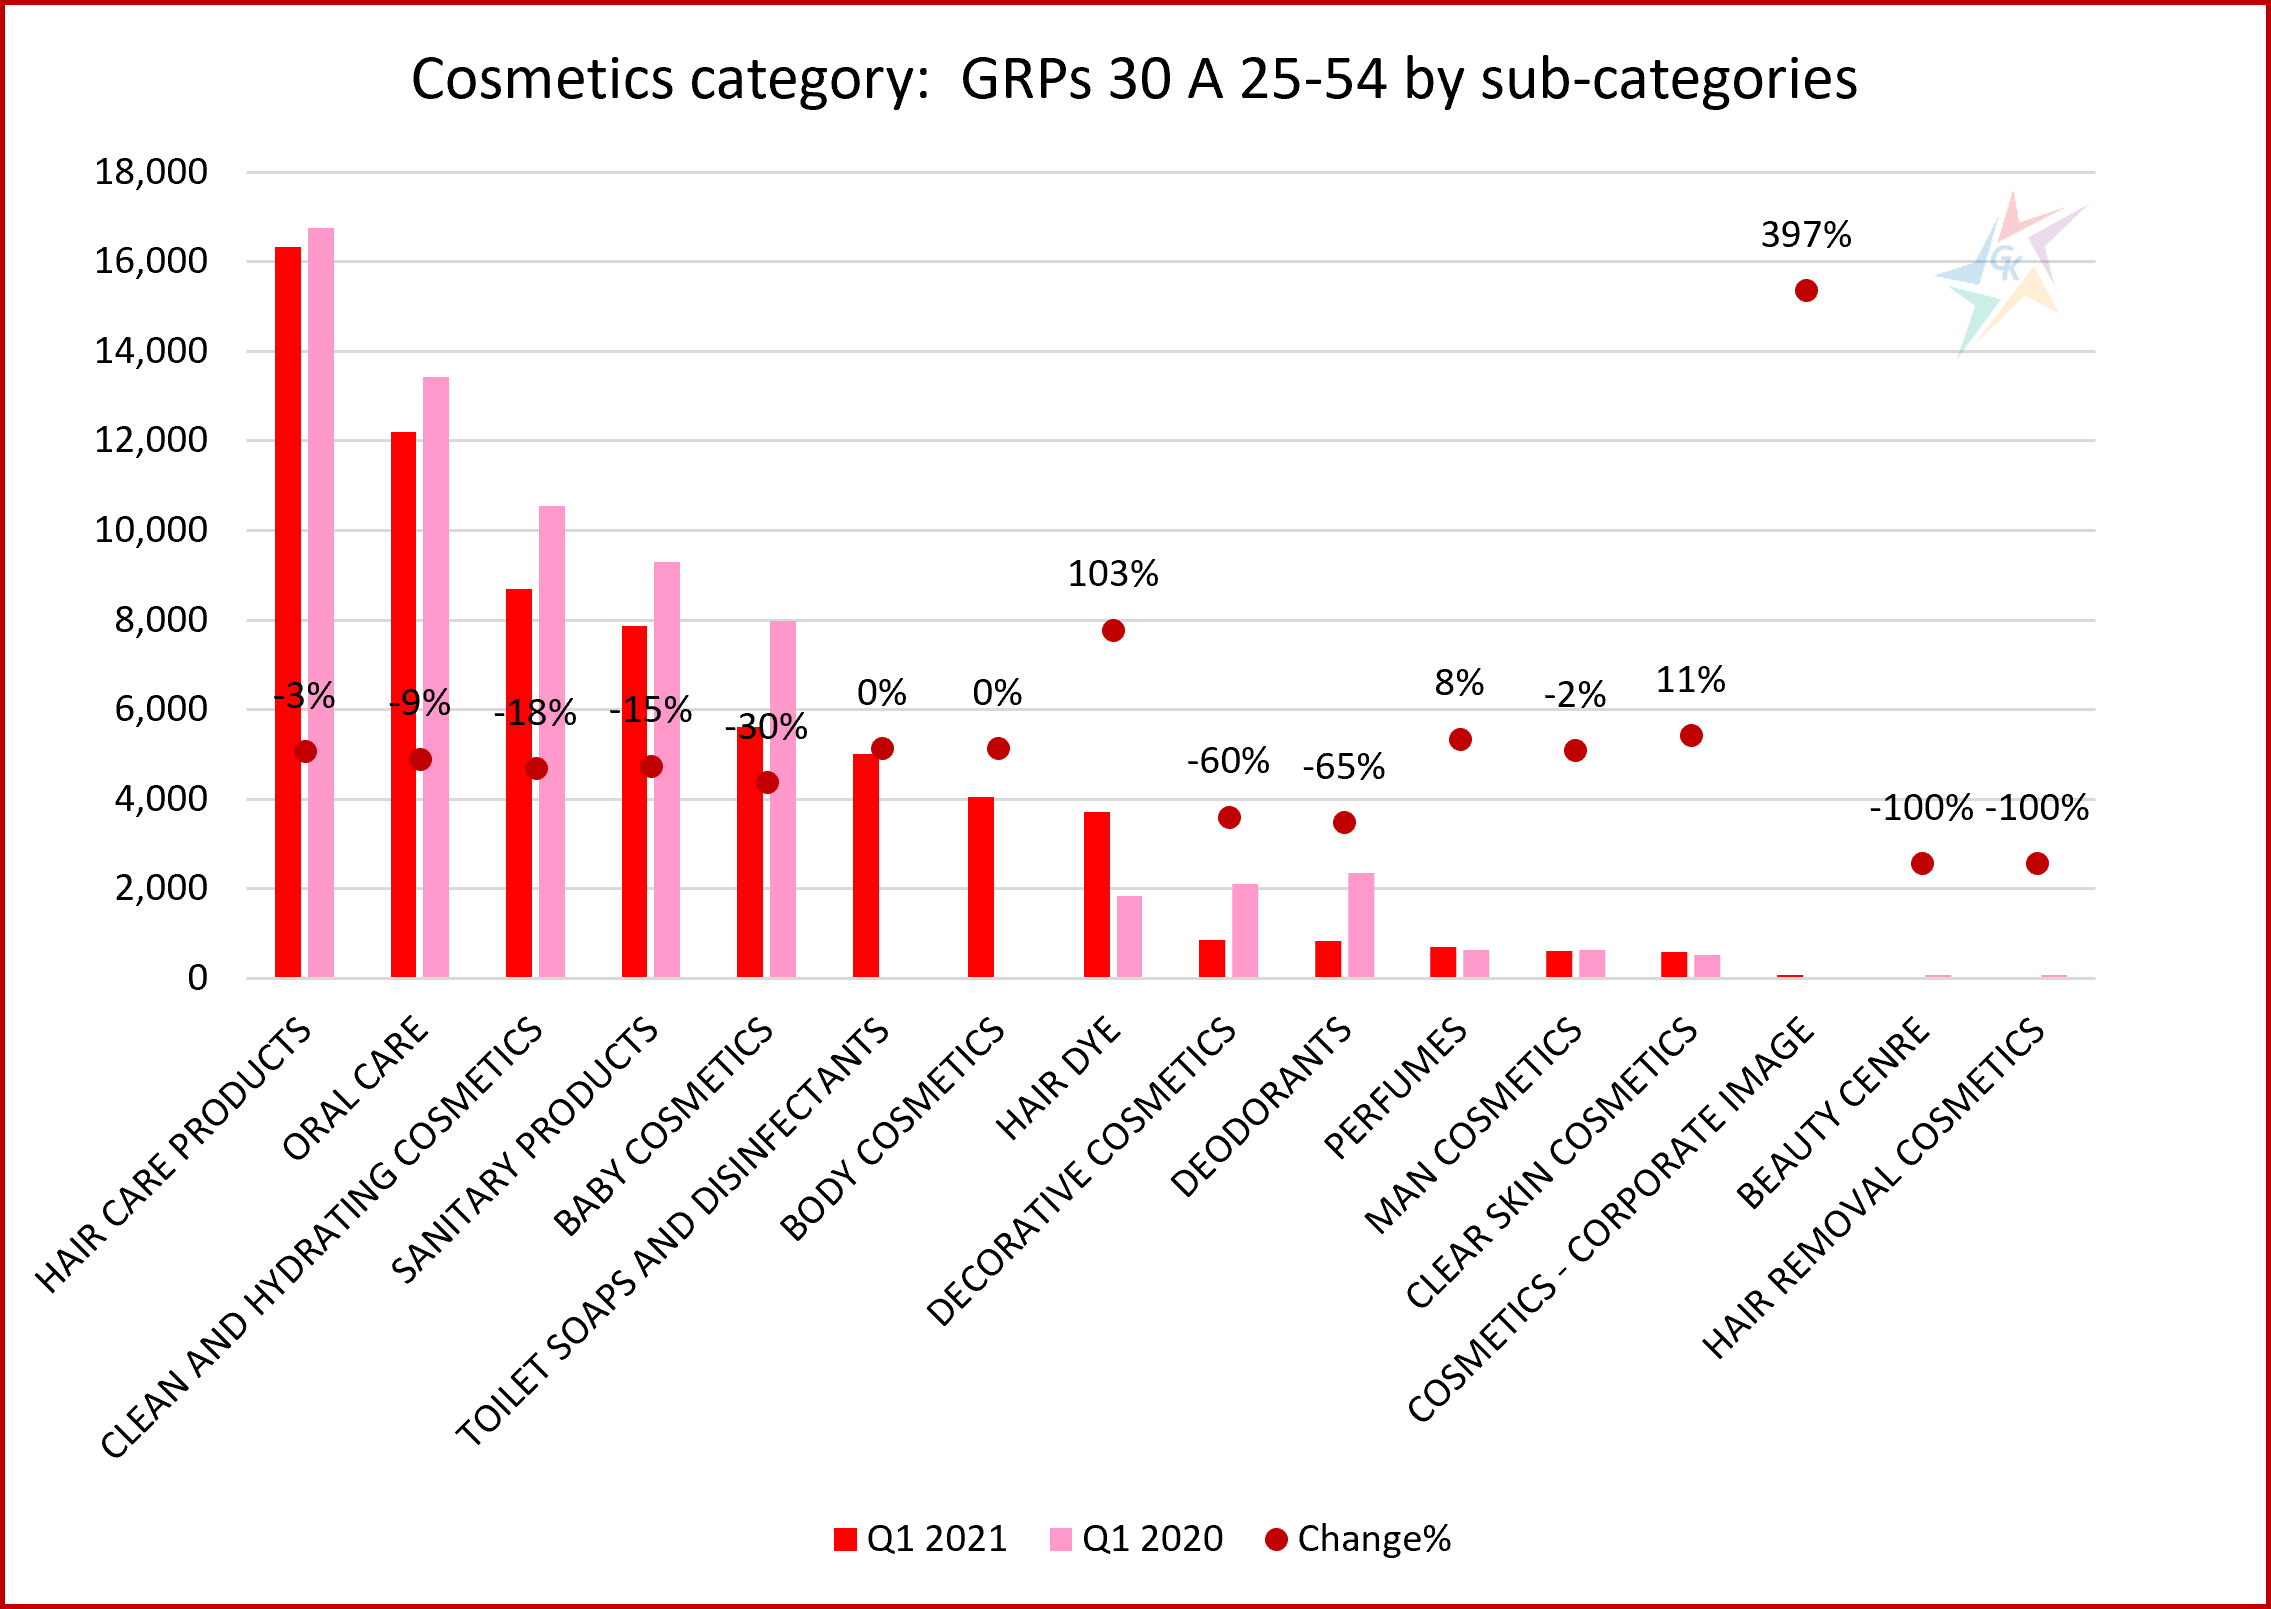
Similar to “Pharmaceuticals”, the “Cosmetics” category remains stable with a minimum growth of 1% based on the reported weighted GRPs of 30 and retains the fourth position. It is interesting to note that in this category traditionally the most advertised products such as shampoos and conditioners, oral hygiene products and facial cosmetics are declining, but it is fully compensated by the activation of two passive subcategories in recent years – “Toilets soaps and disinfectants” and “Body cosmetics”, and by growth in the sub-category “Hair dye”. A total of 16 product subcategories were active during the analyzed periods, and the first three represent 55% of the volume of the “Cosmetics” category:
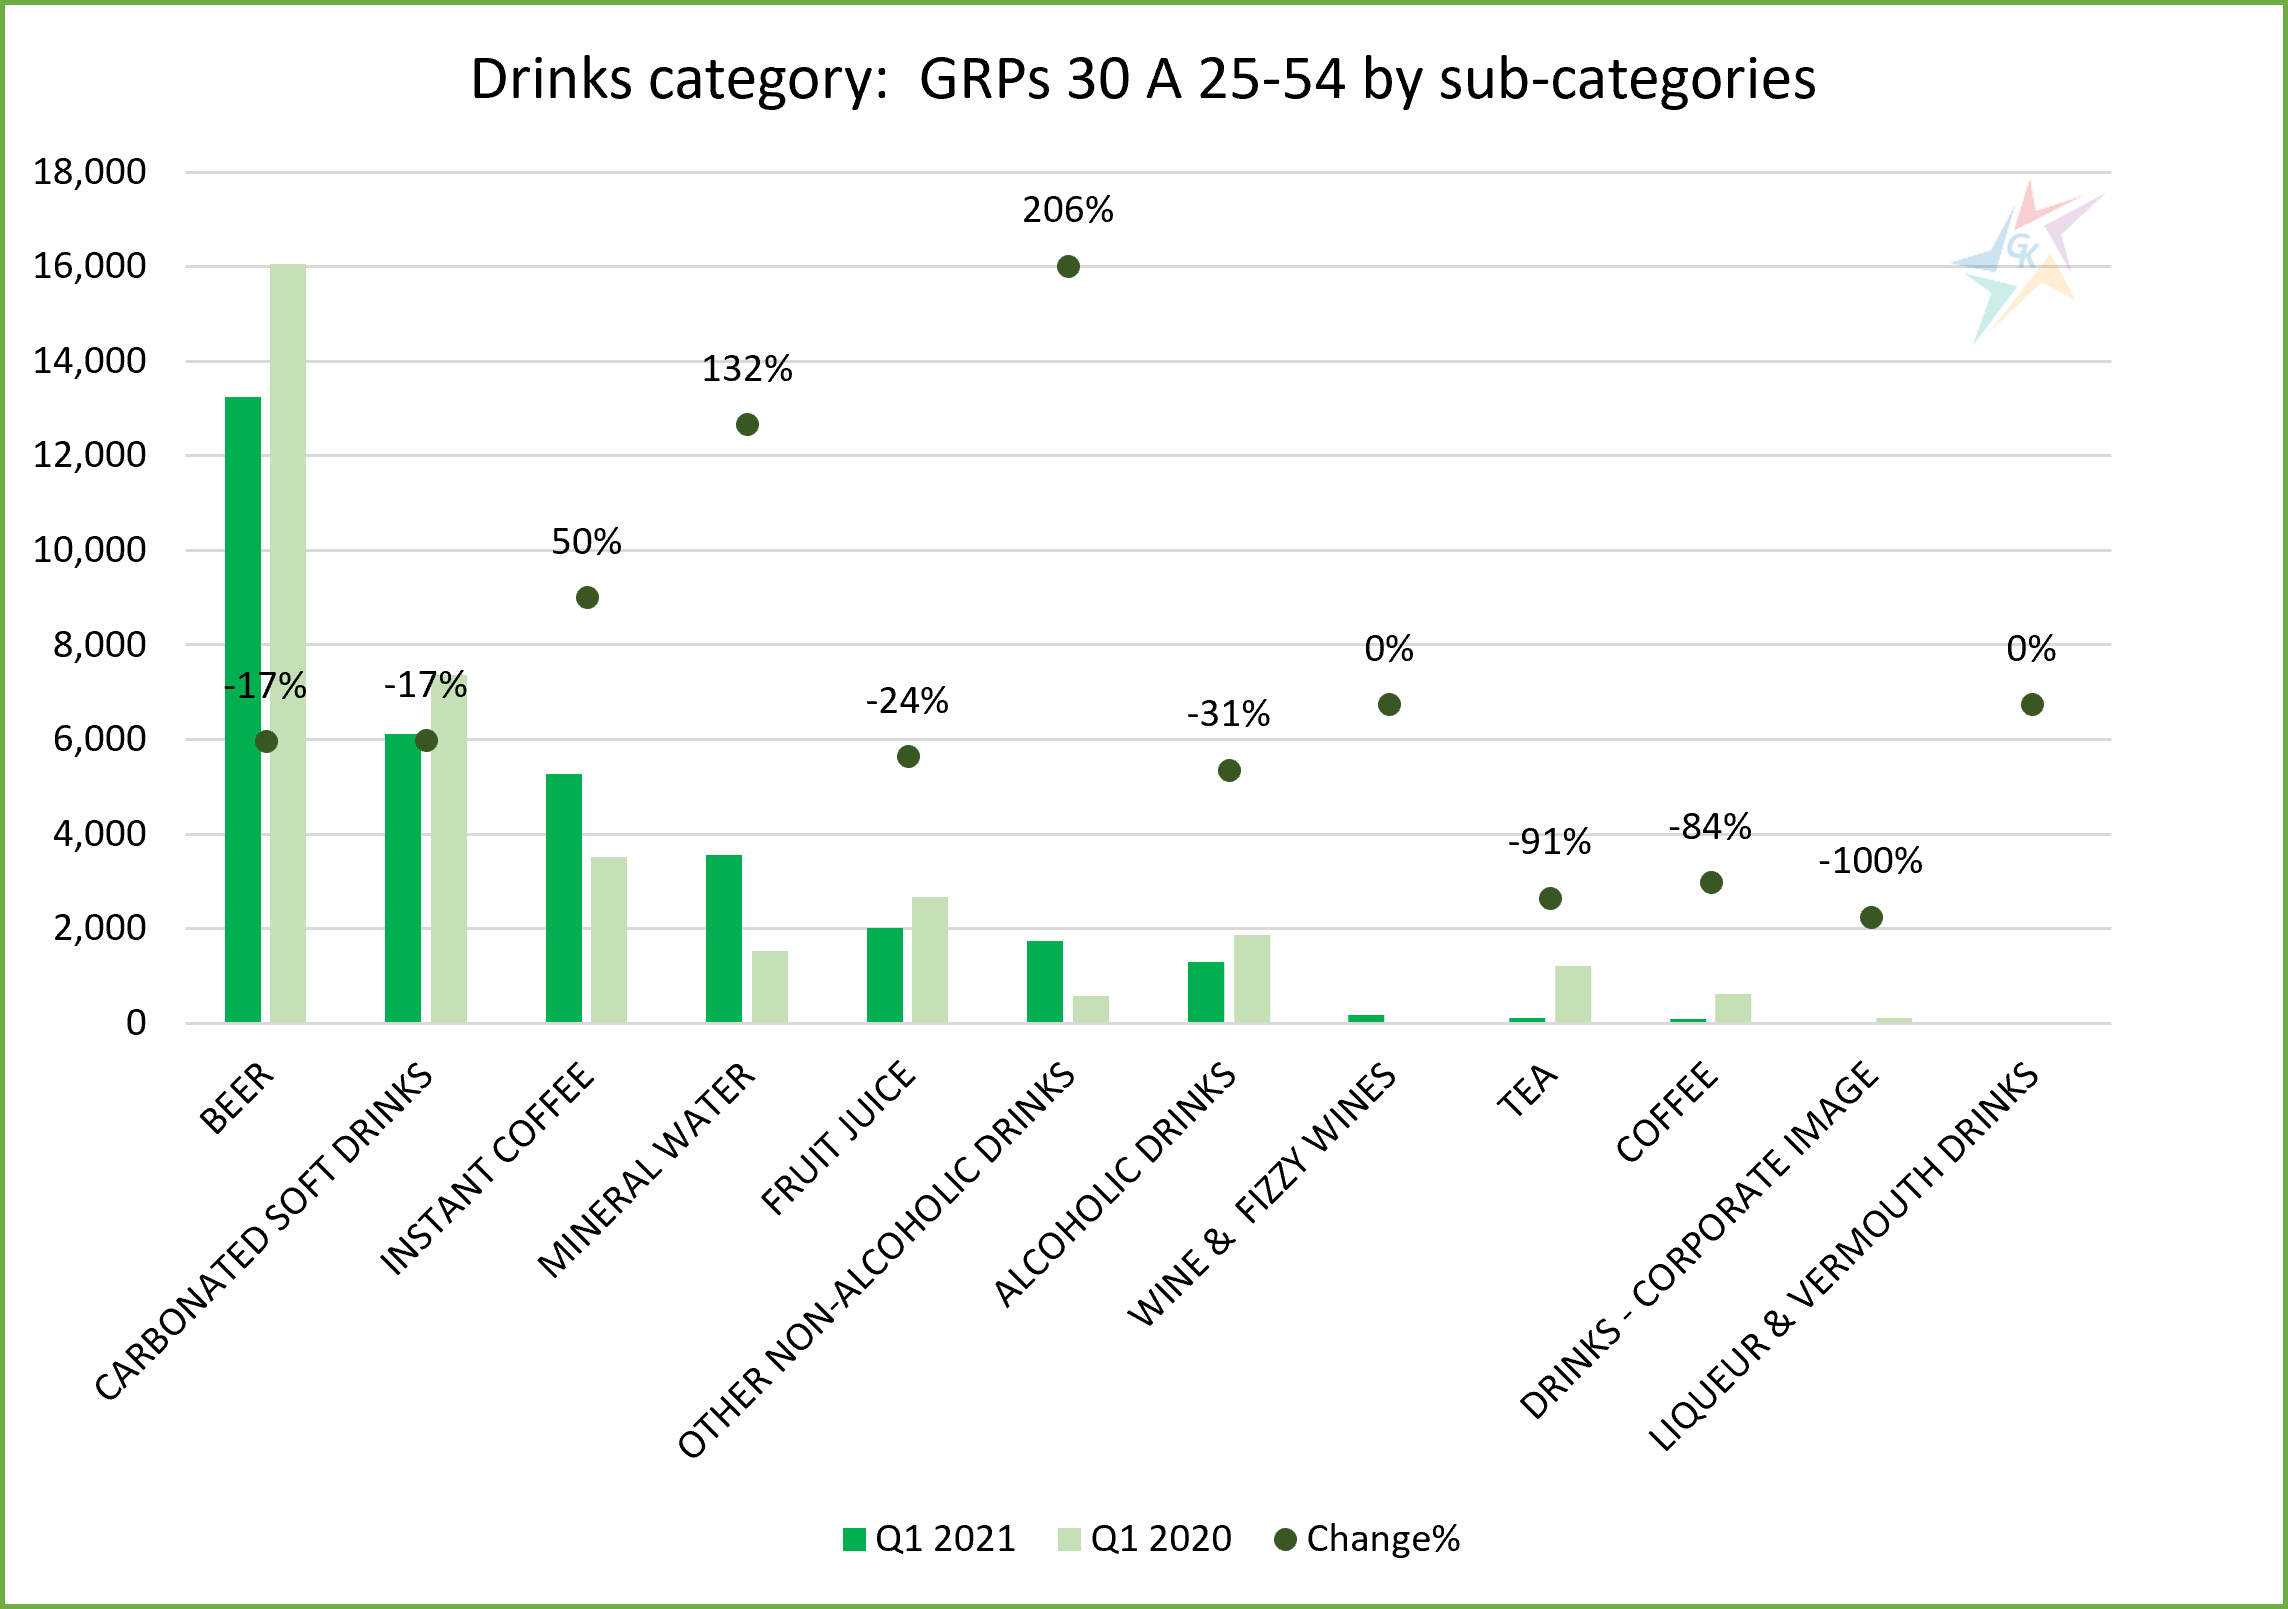
“Drinks” category is on fifth place. This is one position higher, but in general the reported GRPs 30 decreased by 5% compared to a year earlier. The dynamics in the subcategories is high and is strongly influenced by the opportunity for people to visit restaurants and spend time away from home. “Drinks” category consists of 12 subcategories. The “Beer” subcategory is undisputed leader, followed by “Carbonated Soft Drinks” and “Instant Coffee”. The three leading categories account for 73% of the total volume:
In the first quarter of 2021, all other categories accumulate 26% of the total market volume based on weighted GRPs 30 indicator and reported a decrease of 6% compared to the same period a year earlier. In the category “Others” we have summarized the data for the rest 19 categories, which are including 82 subcategories.
For additional information, please contact our team via the contact form.