
Defining the target audience and information about its attitudes, preferences and consumption in the broadest sense are key elements in building a communication strategy. The choice of media and means of expression, as well as the specific messages with which to achieve the set goals of the campaign depend on them. The dynamic environment in which we find ourselves often changes consumer attitudes, creates the need for new products and services and eliminates the need for existing ones. External factors make it difficult for marketers to build and analyze a target group. That is why specially developed software comes to the rescue, which by processing a series of questions and answers explores the attitudes of the audience and discovers hidden patterns of behavior. The purpose of this topic is to introduce you to a little known but very useful platform Theoremus. The system is similar to TGI data, which is not presenting on the Bulgarian market for years, and provides answers to a number of questions, related to the knowledge of the audience and the ability to build its profile. The survey is web-based and is conducted on regular waves. The panel contains information on the urban population aged between 16 and 65 and links to the data officially submitted by the NSI. The data in the Theoremus platform are representative for 3,421,684 Bulgarians, and the possibility to define a target group offers many criteria, such as age, gender, income, marital status, personal interests. One of the advantages of the software is the ability to directly compare between the target groups, thus easily detecting dependencies in the similarities and more importantly – the distinctive features of each. The panel is made up of 1,100 respondents and covers over 670 diverse questions, divided into several sections – demography, lifestyle, devices used, technological and digital activity, finance, shopping, transport and travel, food and drink, traditional and social media, awareness of the brand. In addition to a wide range of questions, the platform provides an opportunity to analyze the answers among a wide range of brands in the following areas:
- Media: social media, TV channels;
- Financial institutions: banks, fast loans;
- Insurance and commercial companies;
- Drinks: beers and ciders, soft and alcoholic drinks, bottled water, coffee;
- Food products: desserts, chocolates, salty products, ice creams, dairy products;
- Cars;
- Gas stations;
- Cosmetic and sanitary products and oral hygiene products;
- Medicines, food supplements, pharmacies;
- Household chemistry;
- Pet food;
- Retail chains and online stores.
In this way, Theoremus offers an in-depth analysis from different angles and provides specific answers to the audience’s attitudes. In addition to predicting the strength and importance of a product feature, data analysis allows us to identify emerging needs and trends among consumers. It is important to note that in addition to representative data, Theoremus also provides real-time control over the quality of the study. The questionnaire is filled in online and is completely anonymous, and the system checks the time for which the respondent gave his answers and assesses the quality of the conducted interview.
The first functionality of Theoremus, which we will consider in this topic, is the ability to compare between different target groups. To this end, we have selected some interesting questions related to everyday habits and we present to you the ten most frequently mentioned answers given by men and women between the ages of 16 and 65, urban population:

To the question “What do you do in your spare time?” Both, men and women, answer that they prefer to rest at home. Given the events of the past year and the fact that the survey was conducted in April 2021, the answer is no surprise. The differences are beginning to show in the subsequent possibilities. For example, for men among the most frequently mentioned options are “Play video games” and “Go fishing”, and for women – “Engage in DIY and decorations” and “Engage in arts”.
The most popular answers in terms of shopping, which, although it has become a routine for almost everyone, is characterized by established habits and perceptions of both genders are also interesting.
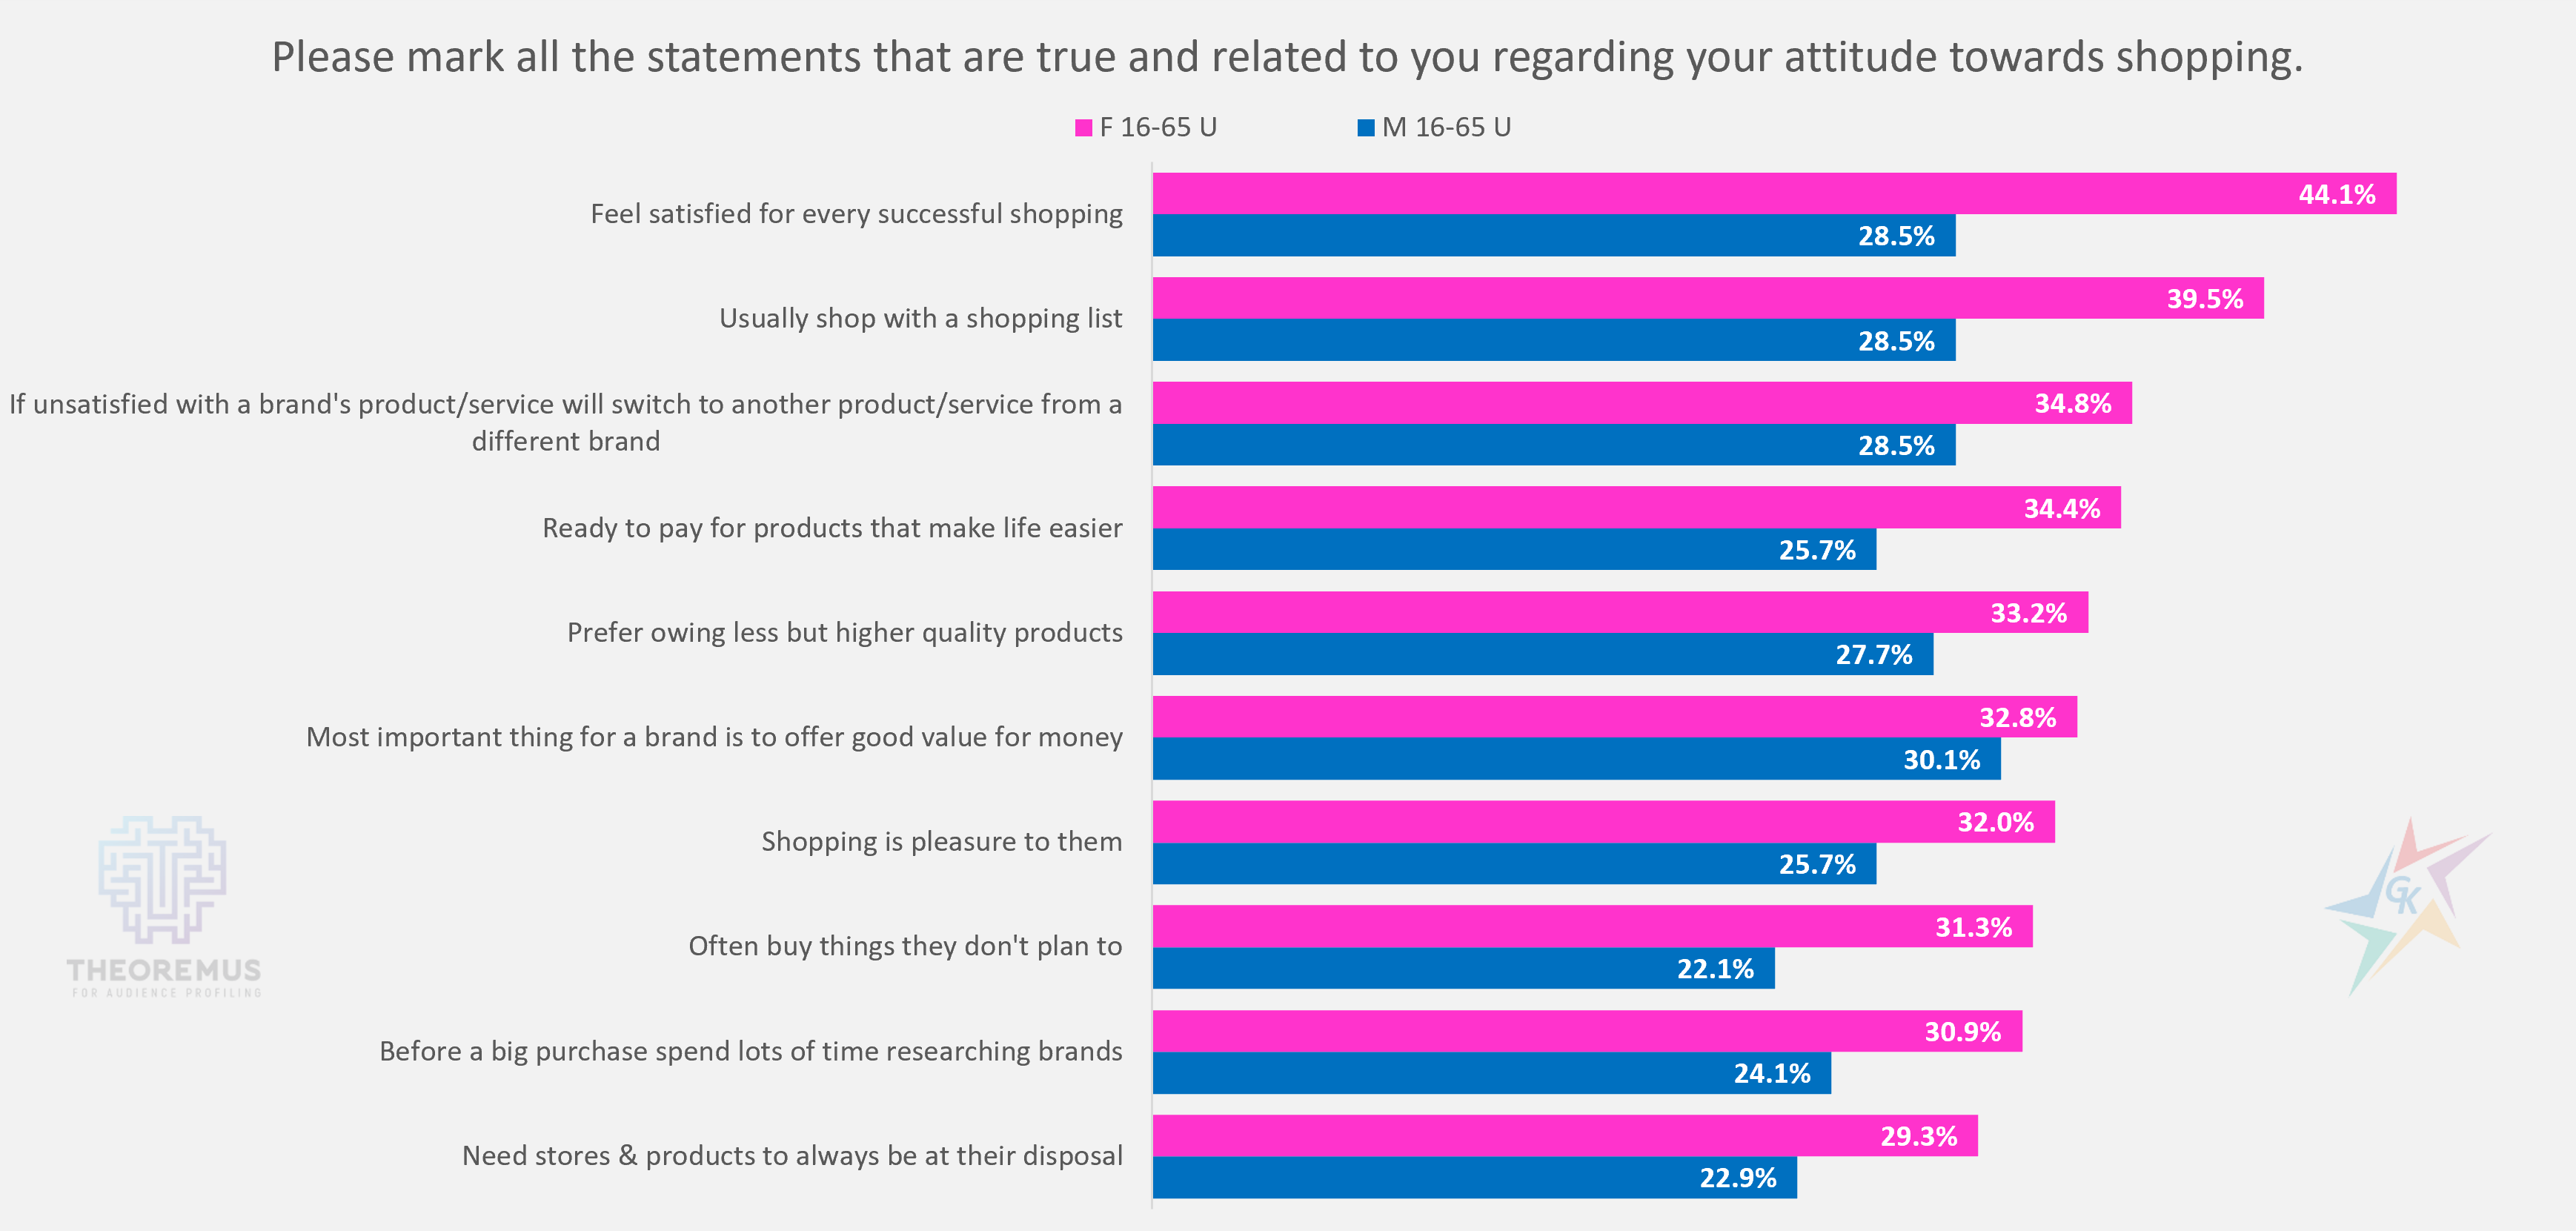
If men respond pragmatically and point out that the most important thing for a brand is to offer good value for money, then for women the feeling of satisfaction for every successful shopping is of paramount importance. Most of the female target group states that they shop with a list, but one of the statements they recognize as true is ” Often buy things they don’t plan to”.
In addition to the percentage ration of these responses, Theoremus also provides information on how distinctive a given characteristic is for the studied target group. The system calculates the distinctiveness of the options and gives them numerical expression. The higher the value of distinctiveness of a given answer, the more typical it is for the analyzed audience. For example, “Most important thing for a brand is to offer good value for money” (96) is the most distinctive answer for men. For women, the most typical answers are “Feel satisfied for every successful shopping” (121), as well as the statement that “Often buy things they don’t plan to” (117).

The considered examples are only highlights from the wide range of questions, answers and possible target groups for analysis provided by the Theoremus platform.
To illustrate other useful functionality, we present the most important answers to questions from the “Media” section:
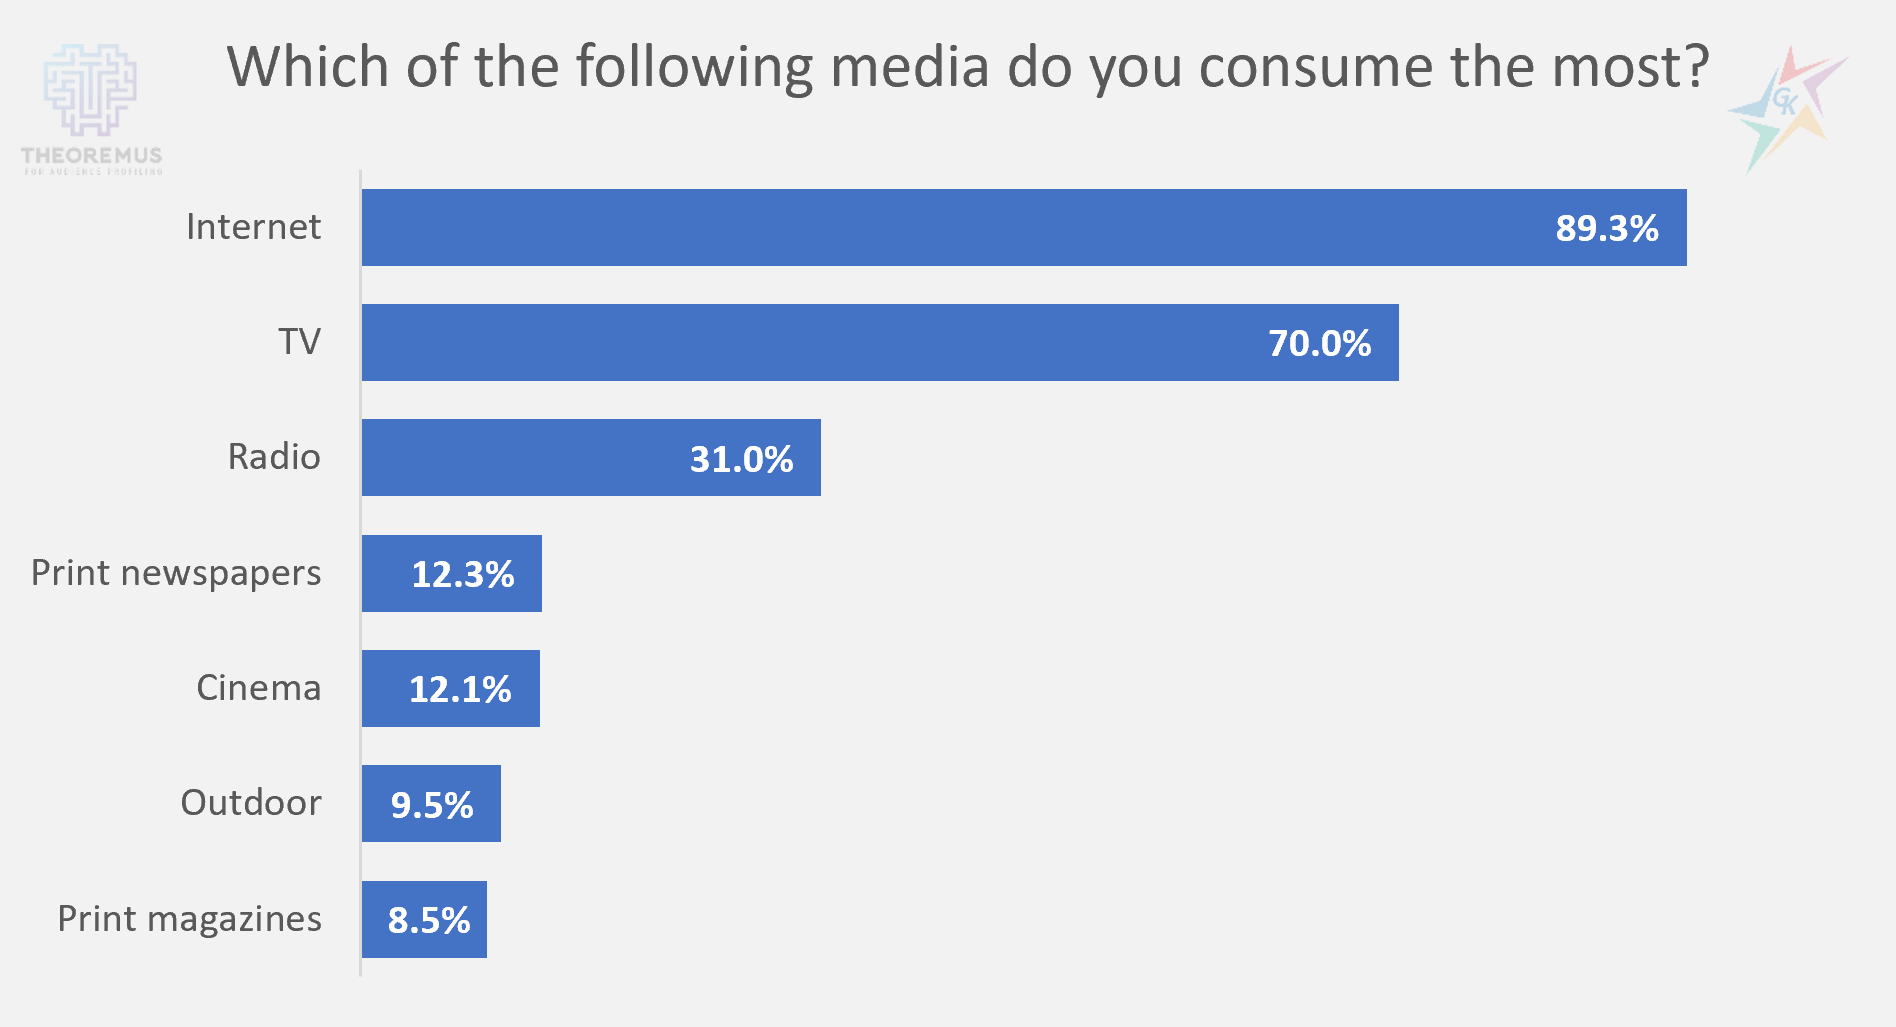
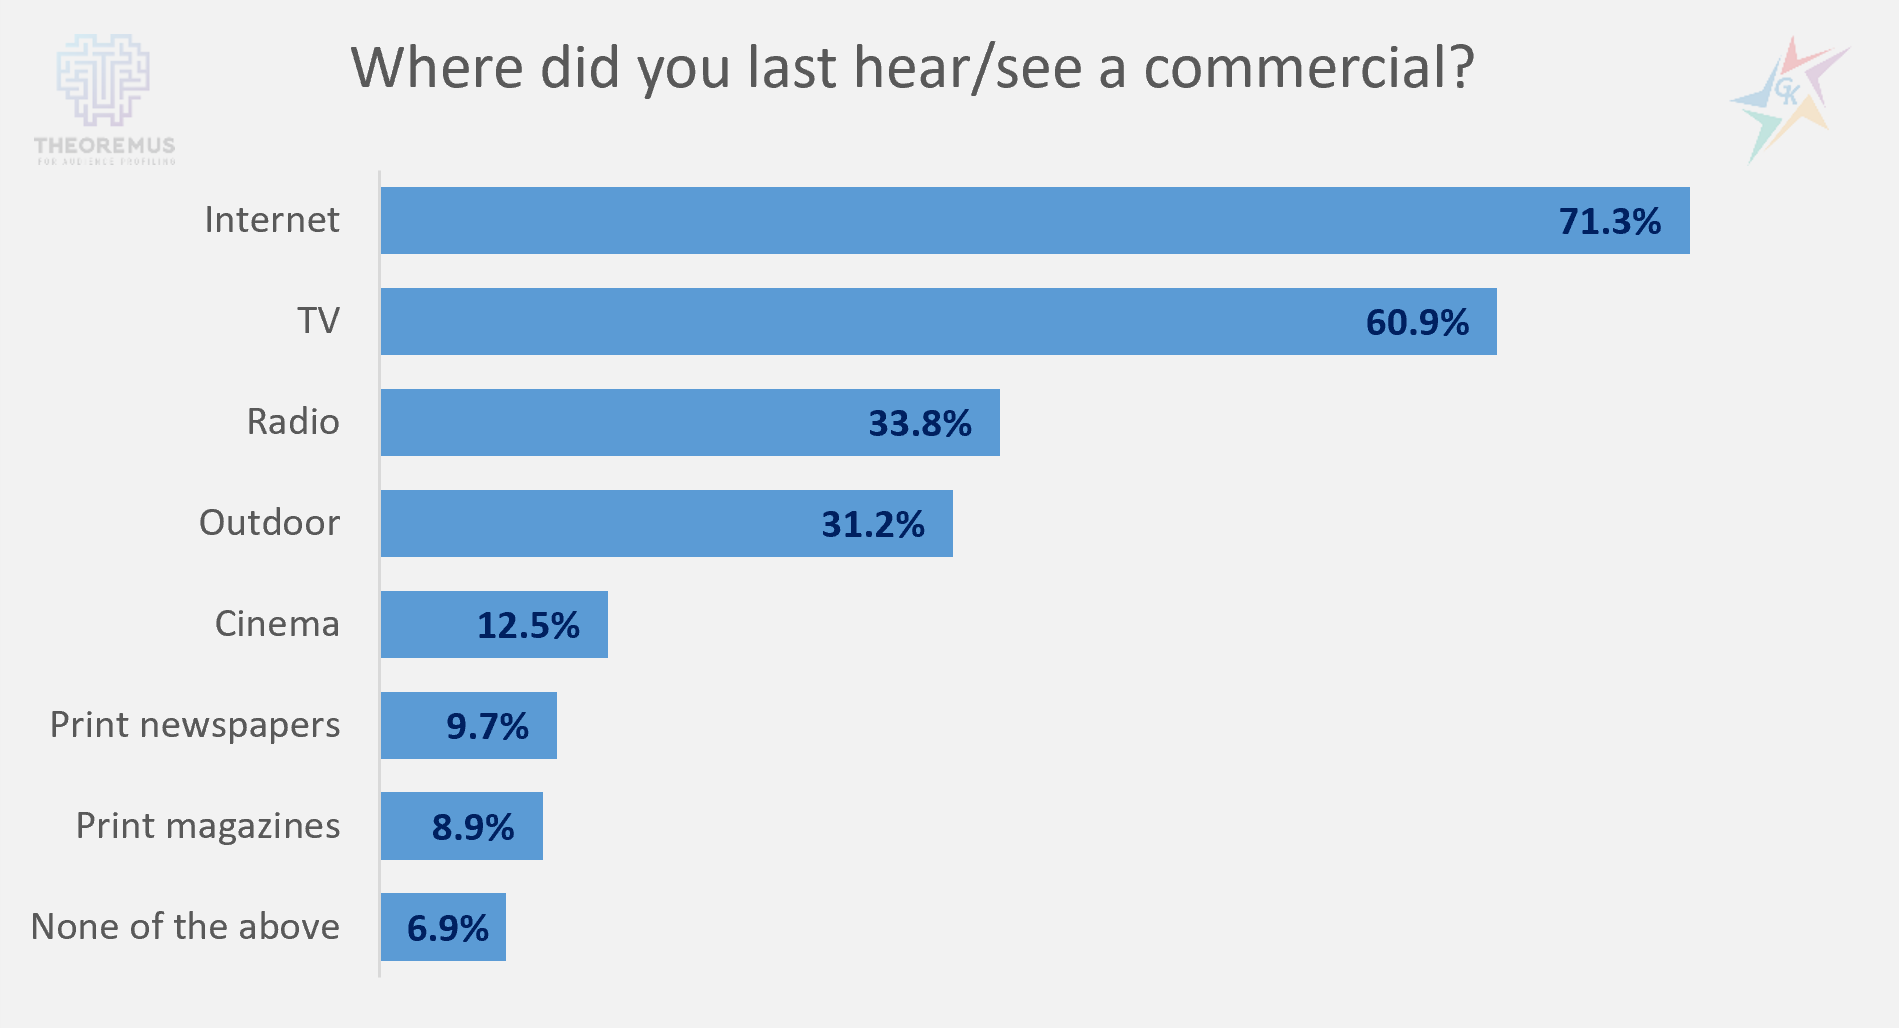
The first chart shows ranking of the most frequently used media channels, and the second one reveals in which type of media the respondents last noticed an advertising message. Unsurprisingly, the answers reveal that the Internet and television are the media we resort to most often. The background noise created by these media channels is high and therefore the advertising messages in them often remain less noticeable to the audience. In contrast, radio advertising stands out more in the minds of the target group. To the question ” Where did you last hear/see a commercial? ” 33.8% answered on radio, and 31% answered that radio is one of the most frequently consumed types of media.
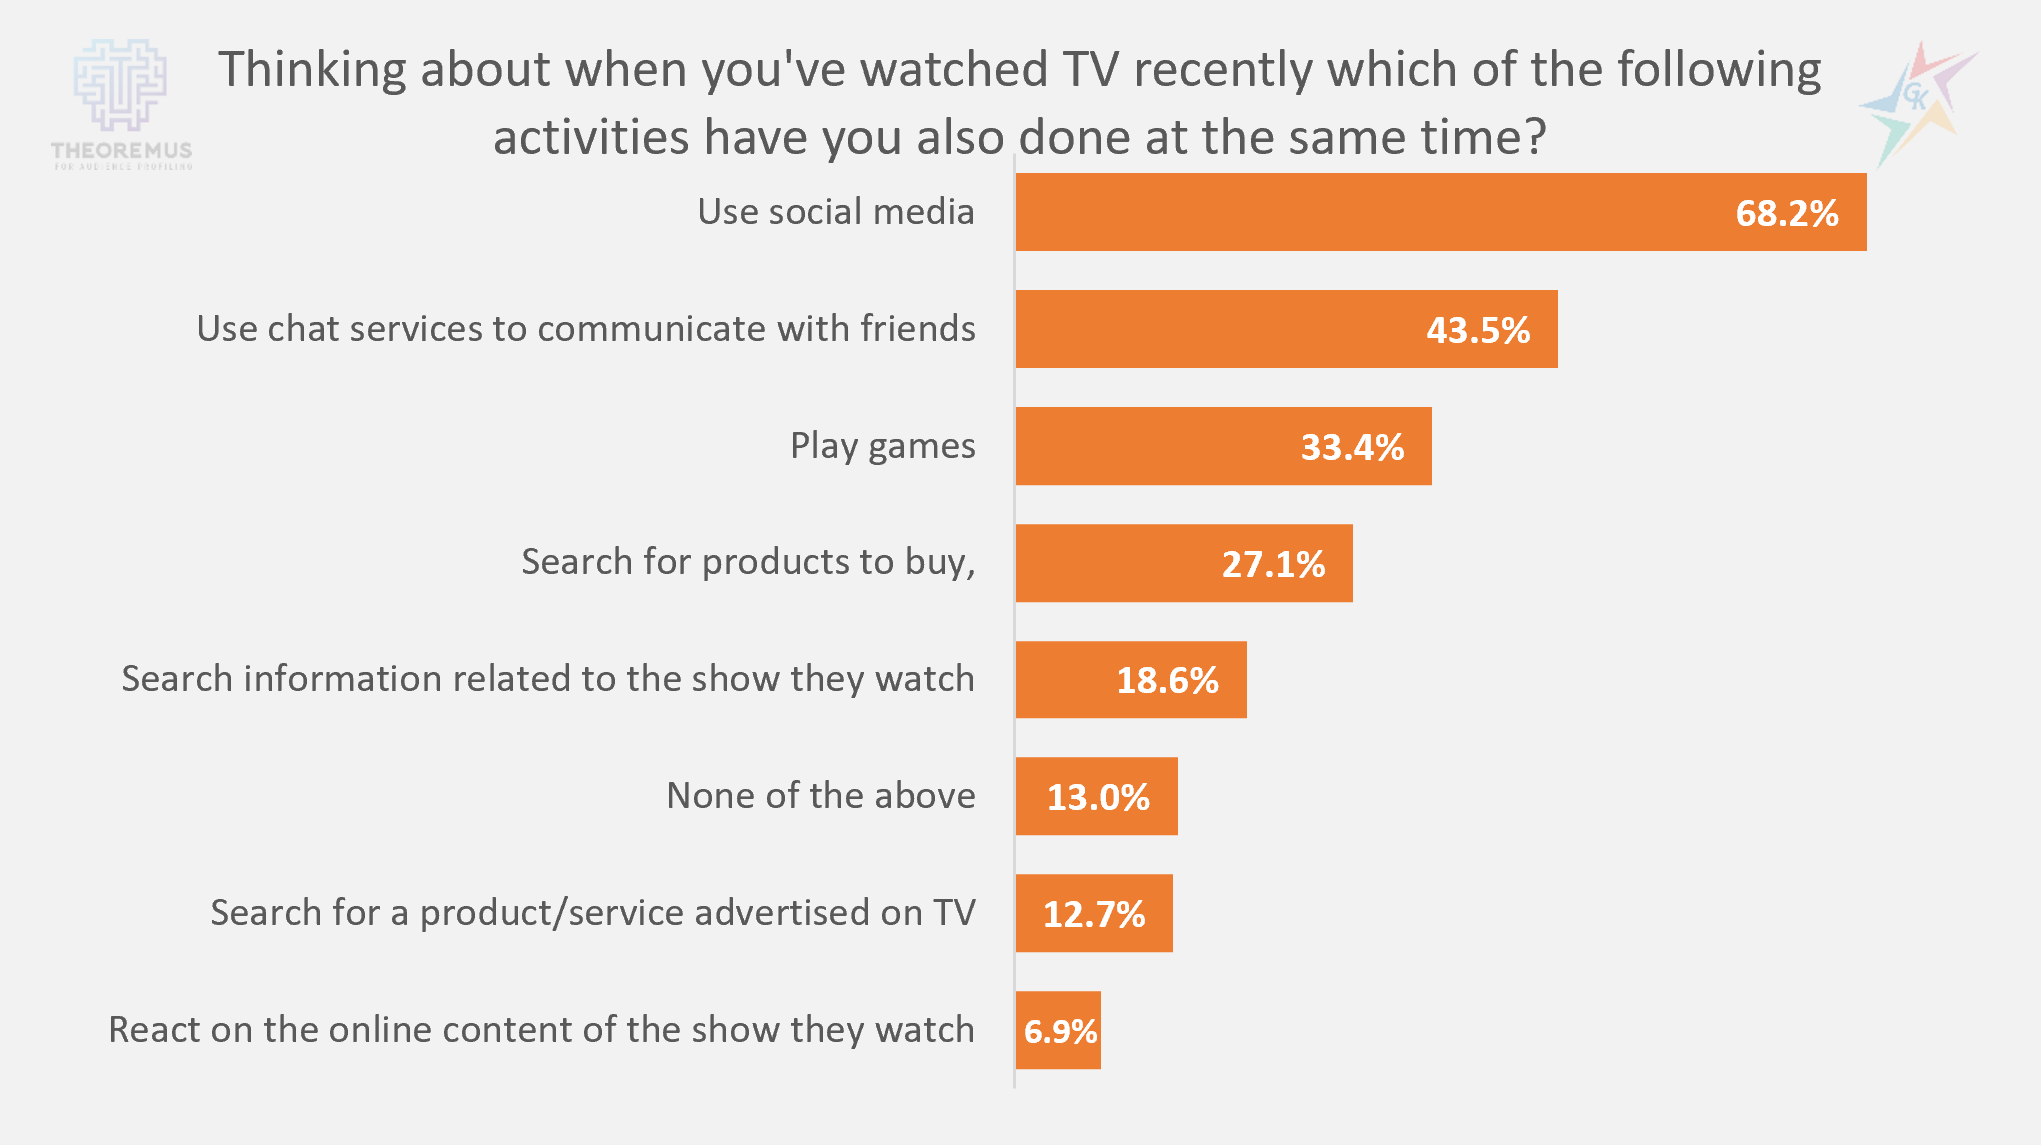
Often the viewer’s attention is distracted and the TV in the room is used as a background for other activities. To the question ” Thinking about when you’ve watched TV recently which of the following activities have you also done at the same time?” the highest percentage (68.2%) answered that they have used social media in the meantime. Other common actions that TV audiences take are chatting with friends and playing games. 18.6% of viewers were excited about the TV content and sought additional information about it, and 12.7% undertook a search for a product seen in a TV commercial.
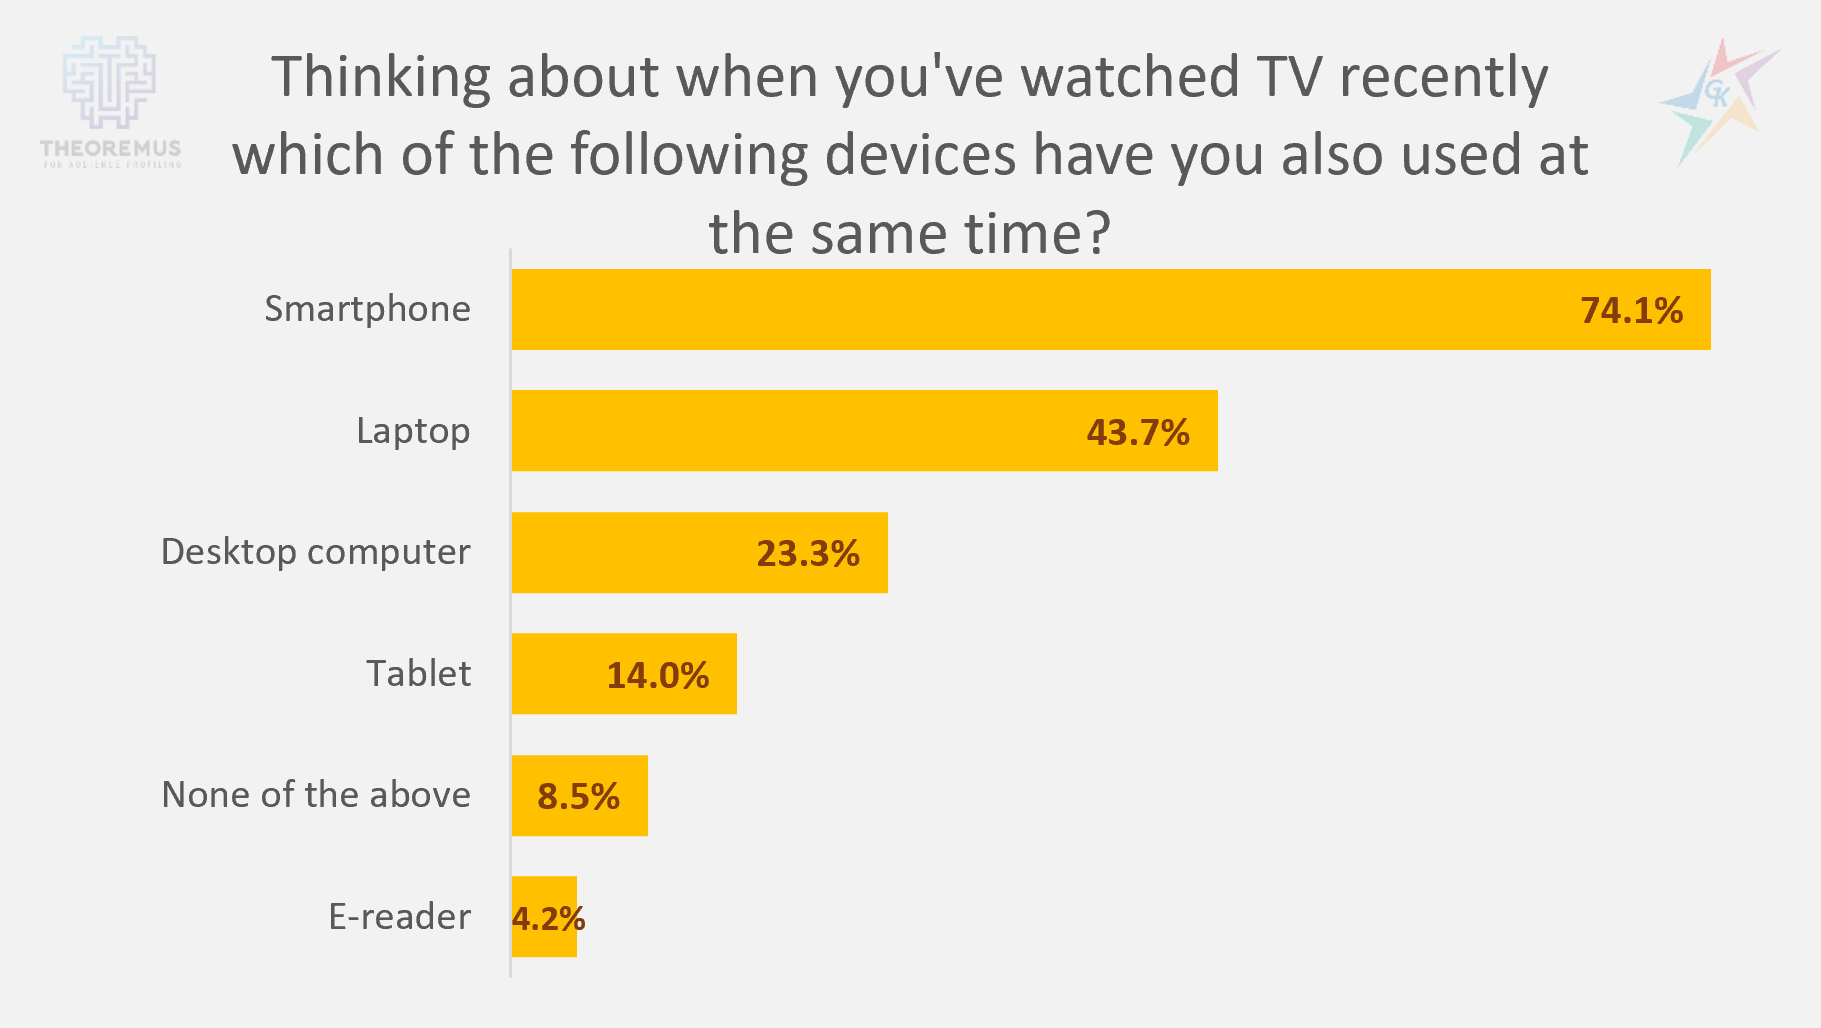
Not surprisingly, the results are presented in the chart above, which shows the devices used while watching TV. The highest percentage – 74.1%, answered the easily accessible smartphone, and only 8.5% answered “None of the above”.
Despite the side effects taken by viewers, television remains one of the strongest media channels, providing wide coverage among the audience. To make sure that our advertising messages reach our target audience the most, it is good to know what TV content our audience is most interested in:
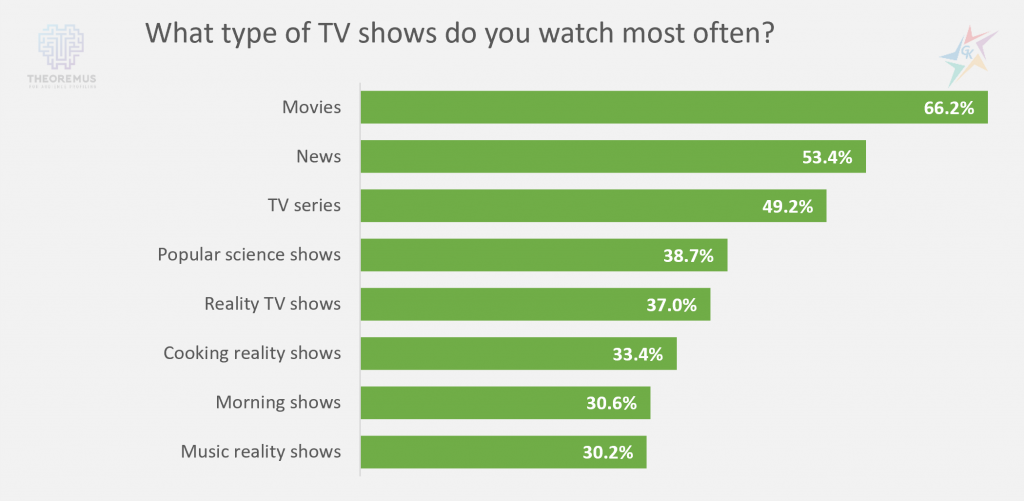
The most popular are movies (66.2%), followed by news (53.4%) and TV series (49.2%). In the background are the various types of reality formats, which are an integral part of the program of leading television.

This summer we expect several sporting events, which traditionally enjoy great spectator interest. 24.5% of the respondents answered that they are interested in and actively follow the European Football Championship, and 22.3% are the fans of the Summer Olympic Games.
The lack of an official source of data for other media channels often leads to their underestimation and less frequent use in the media mix. To get an idea of the audience’s attitudes towards them, we present the following charts based on data from Theoremus:
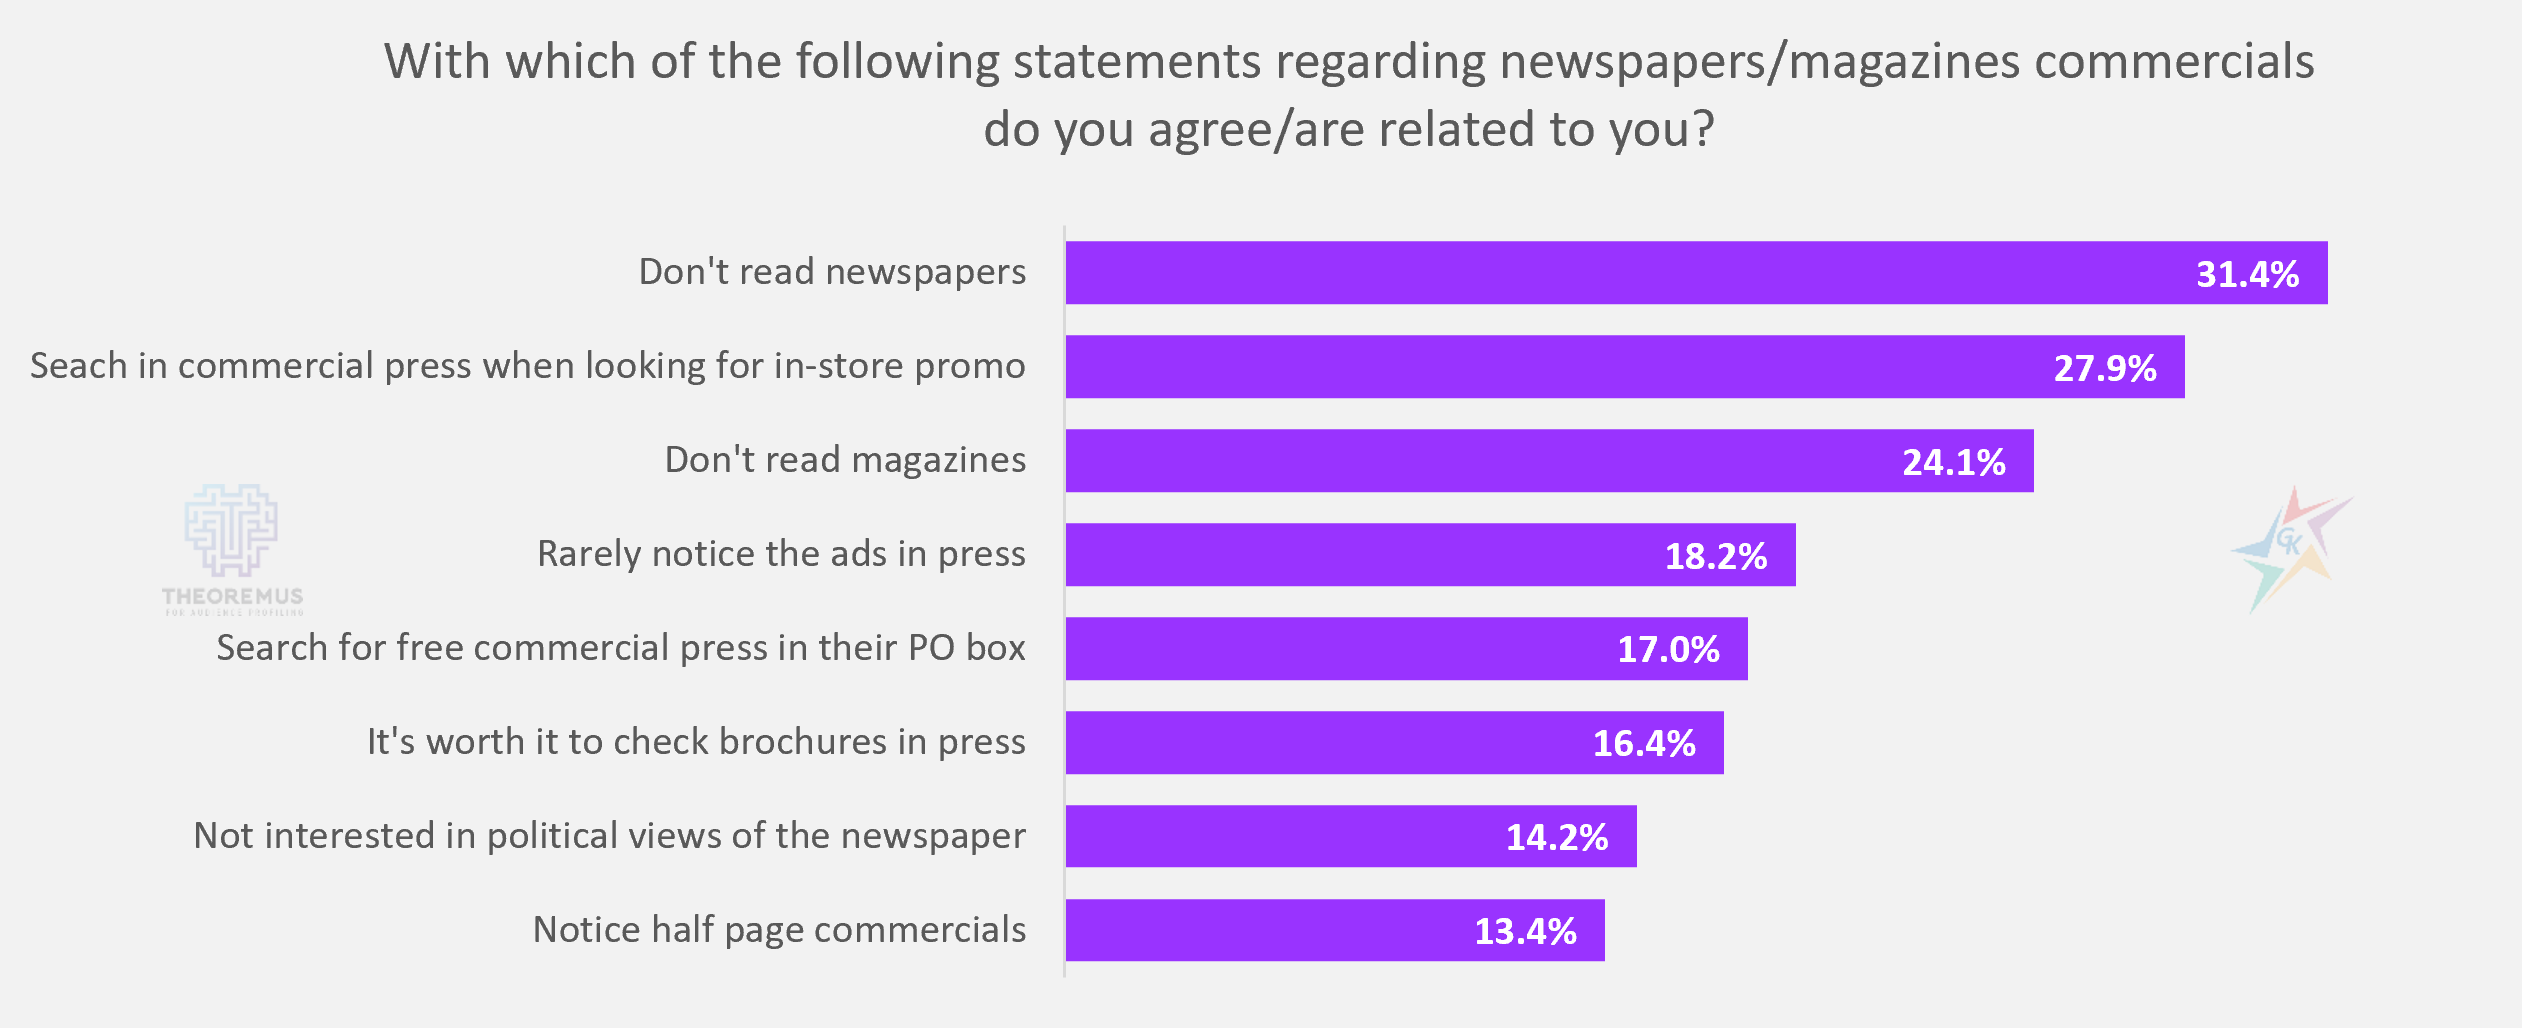
The chart presents ranking of the statements regarding PRINT media, with which the readers are most recognized. 31.4% of the respondents answered that they do not read newspapers (printed), and 24.1% – magazines (printed). A relatively close percentage of the audience agree with the statements that they are looking for free commercial brochures in their PO boxes (17%) and that it is worth checking brochures in the press (16.4%).
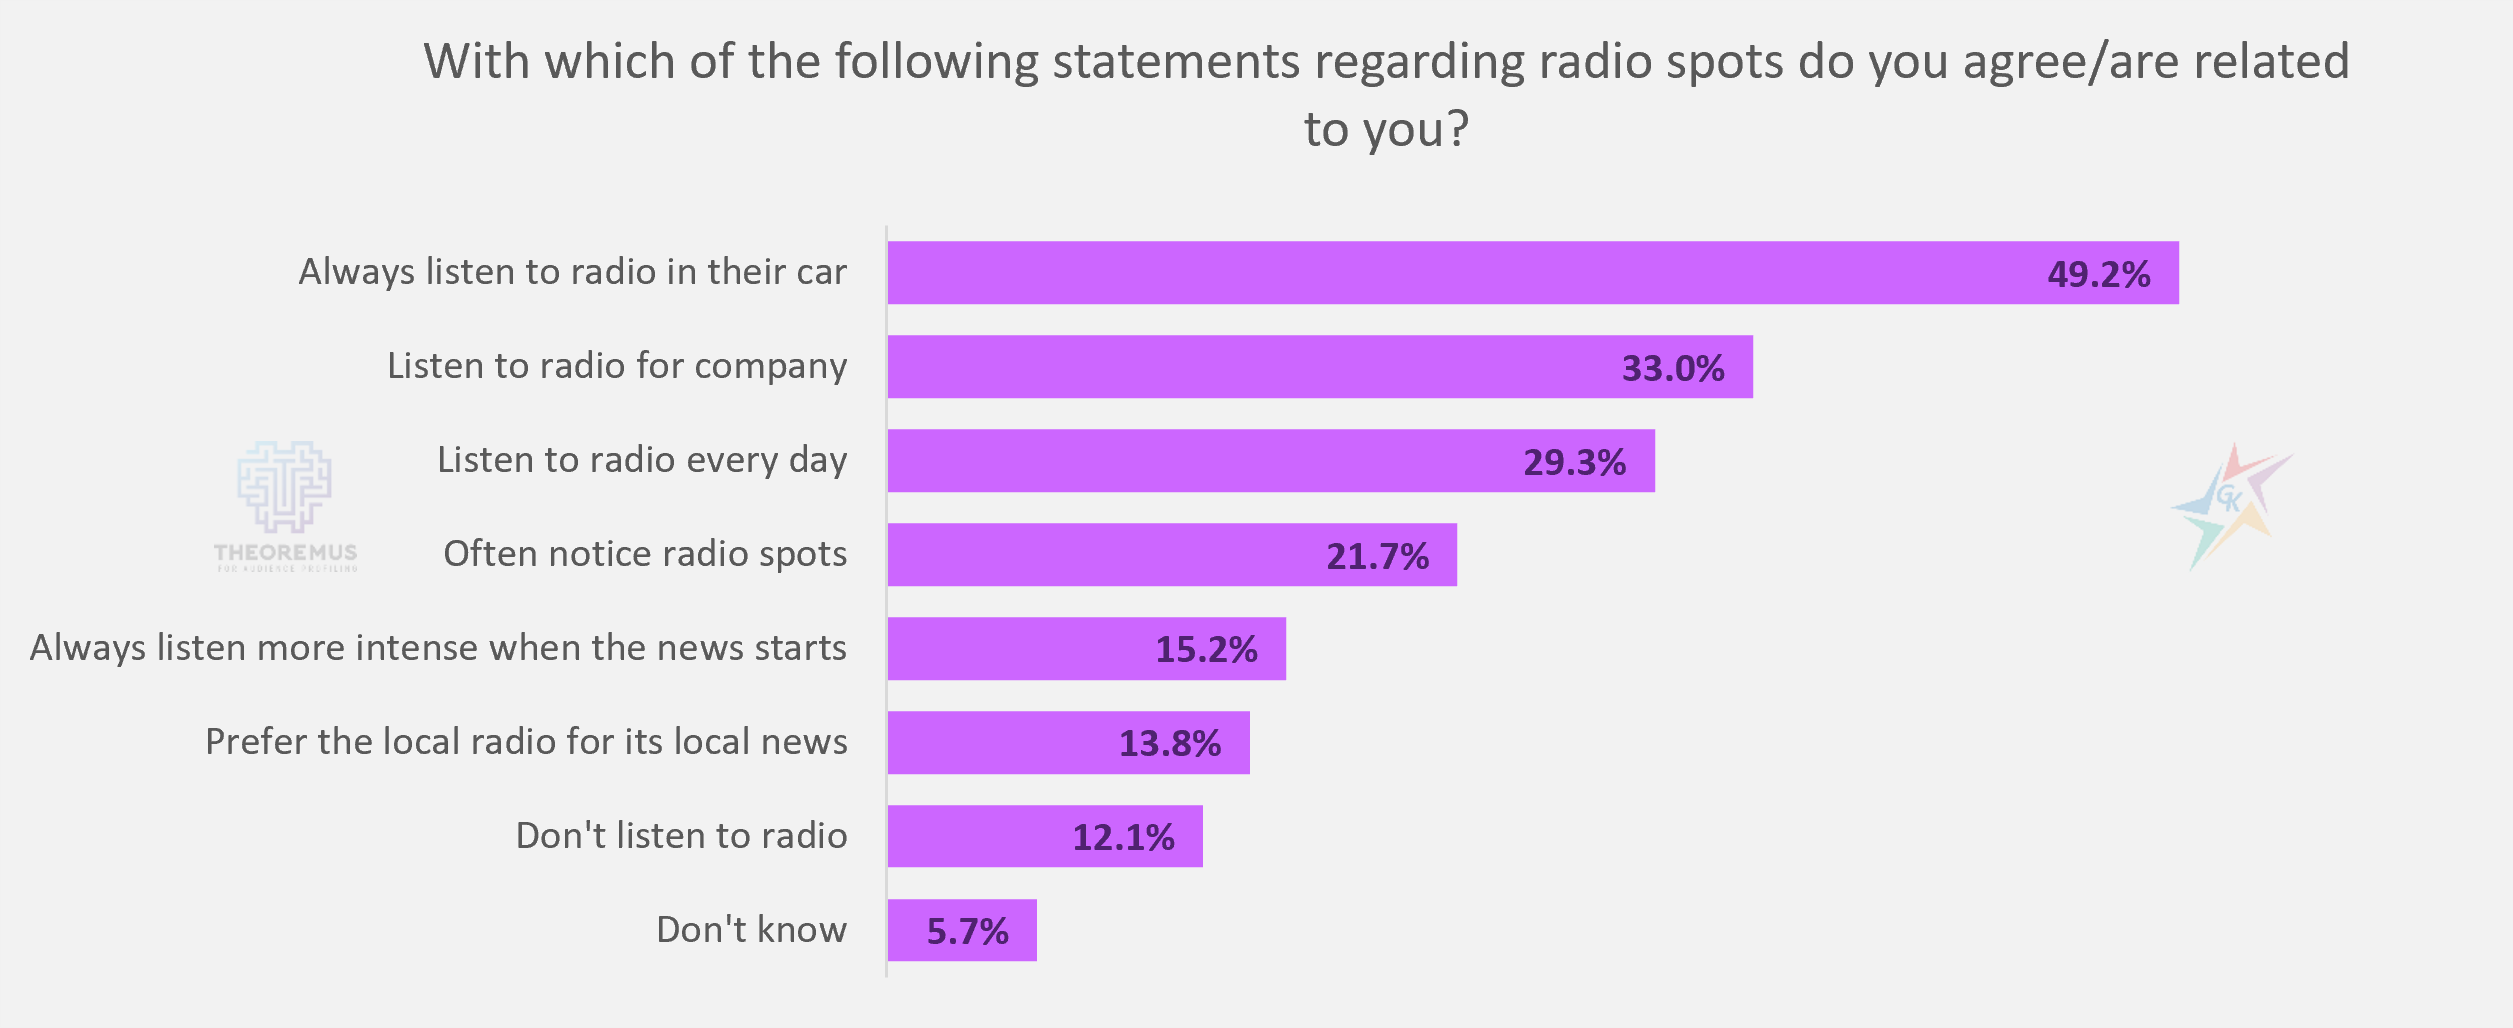
The chart shows that radio fans mostly agree with the statement that when they are in the car they always listen to the radio (49.2%). Almost 30% of respondents listen to the radio every day, and 21.7% are often notice spots on the radio. In addition to background music and good mood, radio often is a source of up-to-date news content. 15.2% of people sharpen their attention when a news program on the radio begins.
In addition to the media channels already described, the Theoremus platform also studies the audience’s attitudes towards outdoor advertising and cinema.
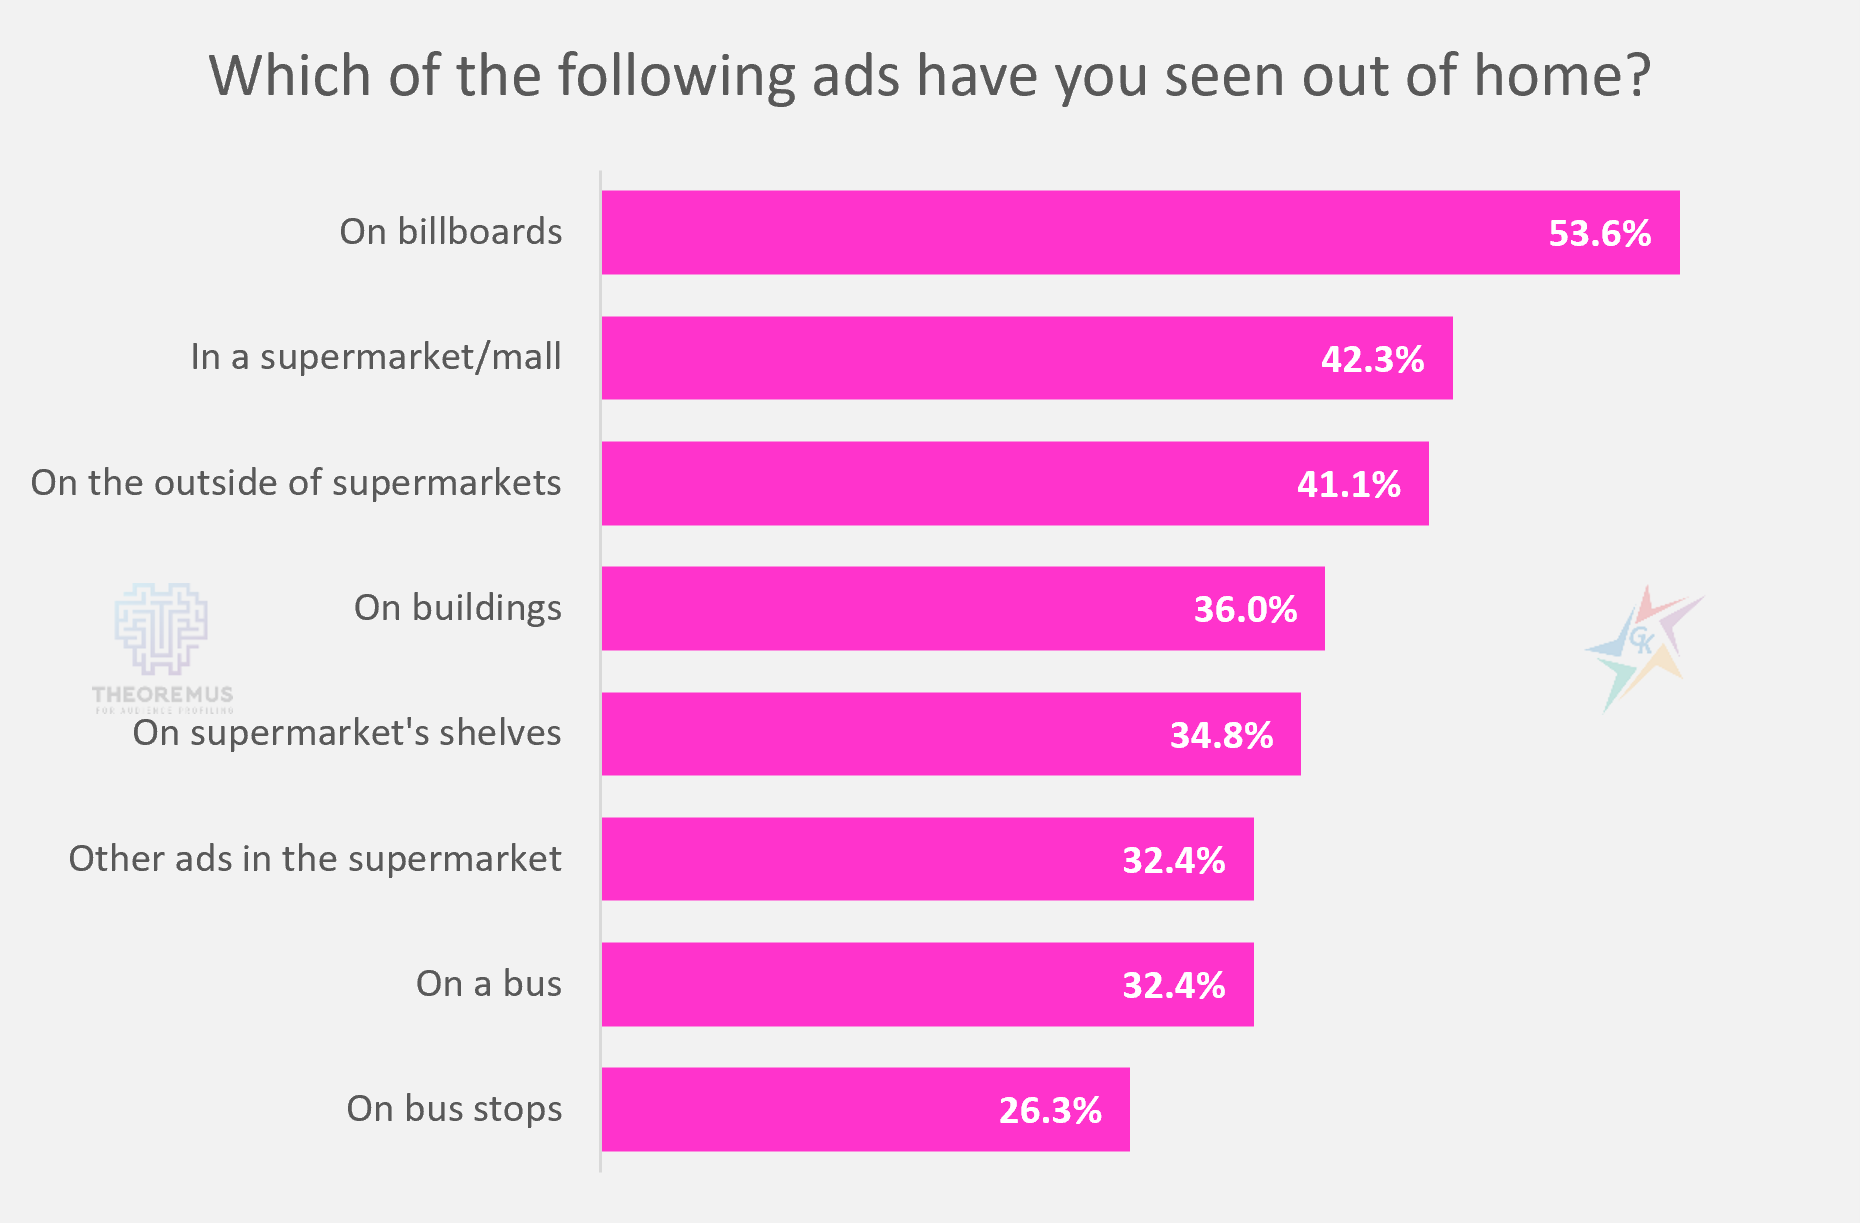
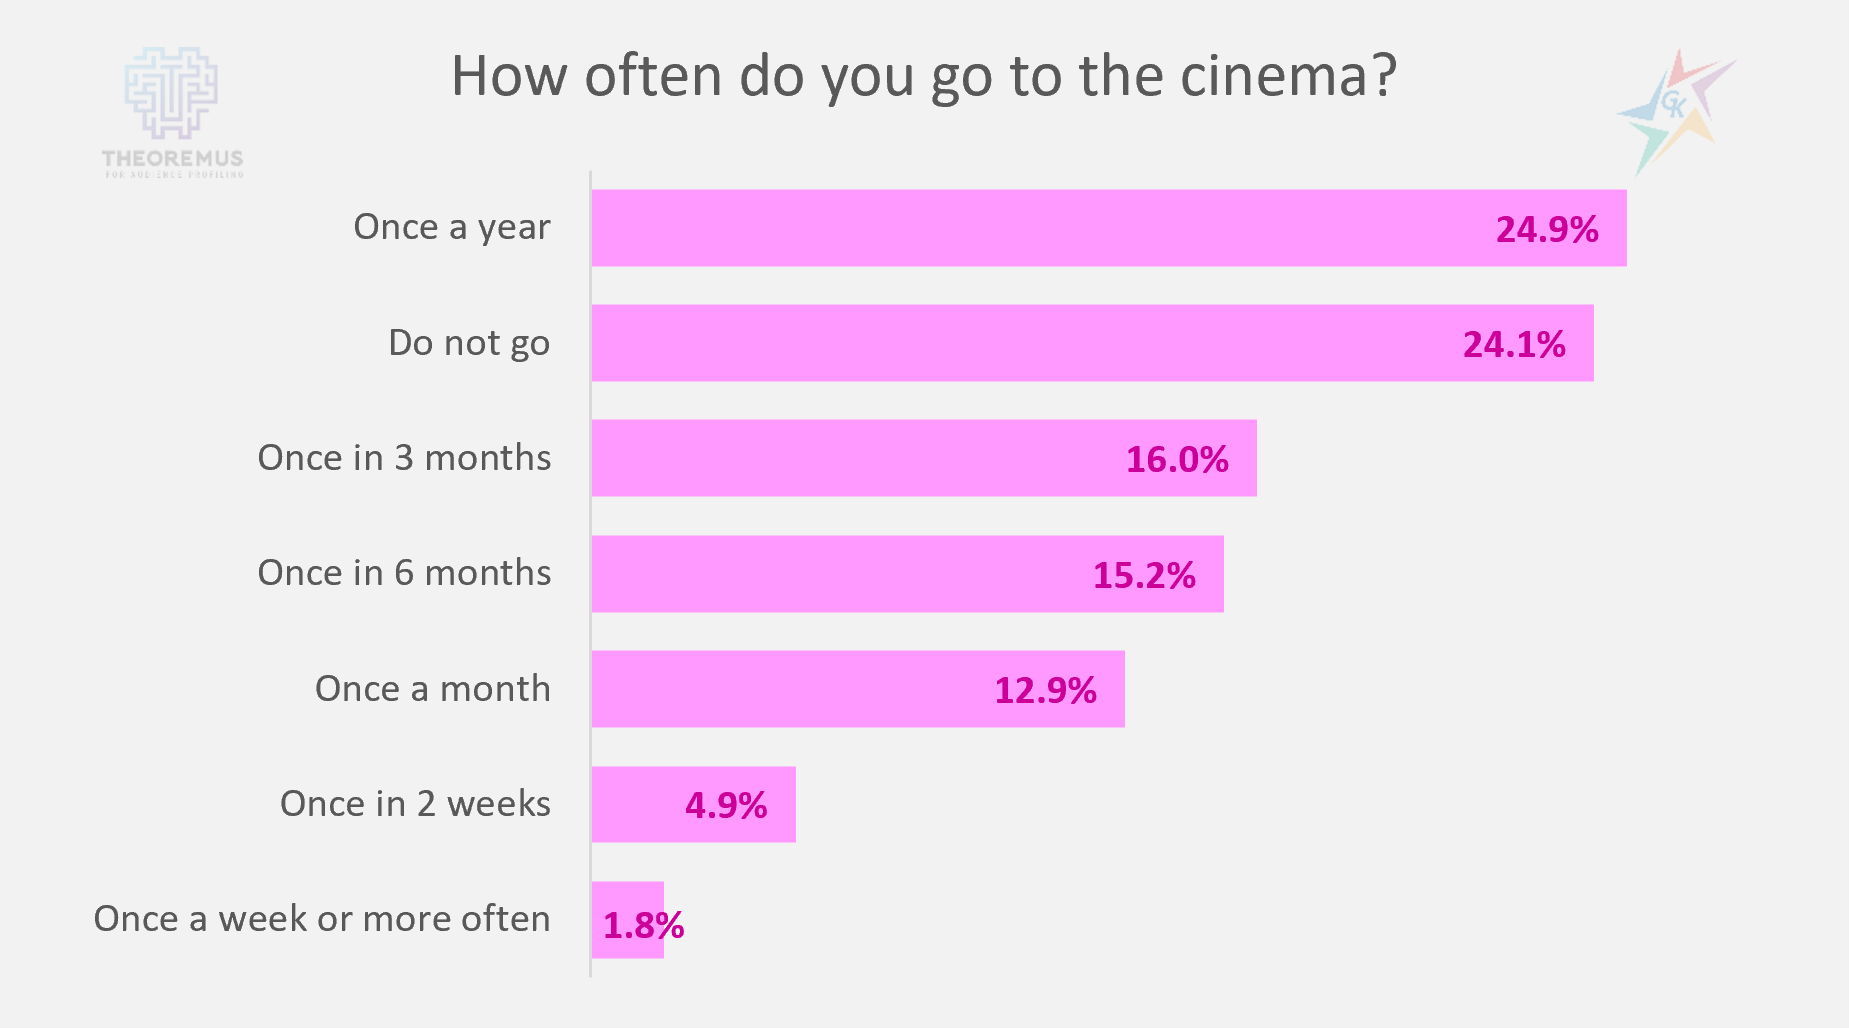
The most noticeable advertising medium out of home is the billboard, 53.6%. Consumers’ attention is often focused on the various media in the supermarket – inside in stores (42.3%), outside stores (41.1%), as well as on the shelves themselves (34.8%). In addition to researching attractive offers for potential purchases, in the last year supermarkets have been constantly open to visitors, unlike large shopping malls, restaurants and cinemas. This is one of the reasons why the largest percentage of people (24.9%) visit cinemas once a year. In April 2021, when the survey was conducted, the percentage of people who do not go to the movies at all continued to remain high – 24.1%.
The charts and data presented are just some of the answers we can get from Theoremus. In addition to traditional media channels, the focus is also on internet consumption and social media. Due to the popularity of these media channels, we present the answers to the questions we ask ourselves most often:
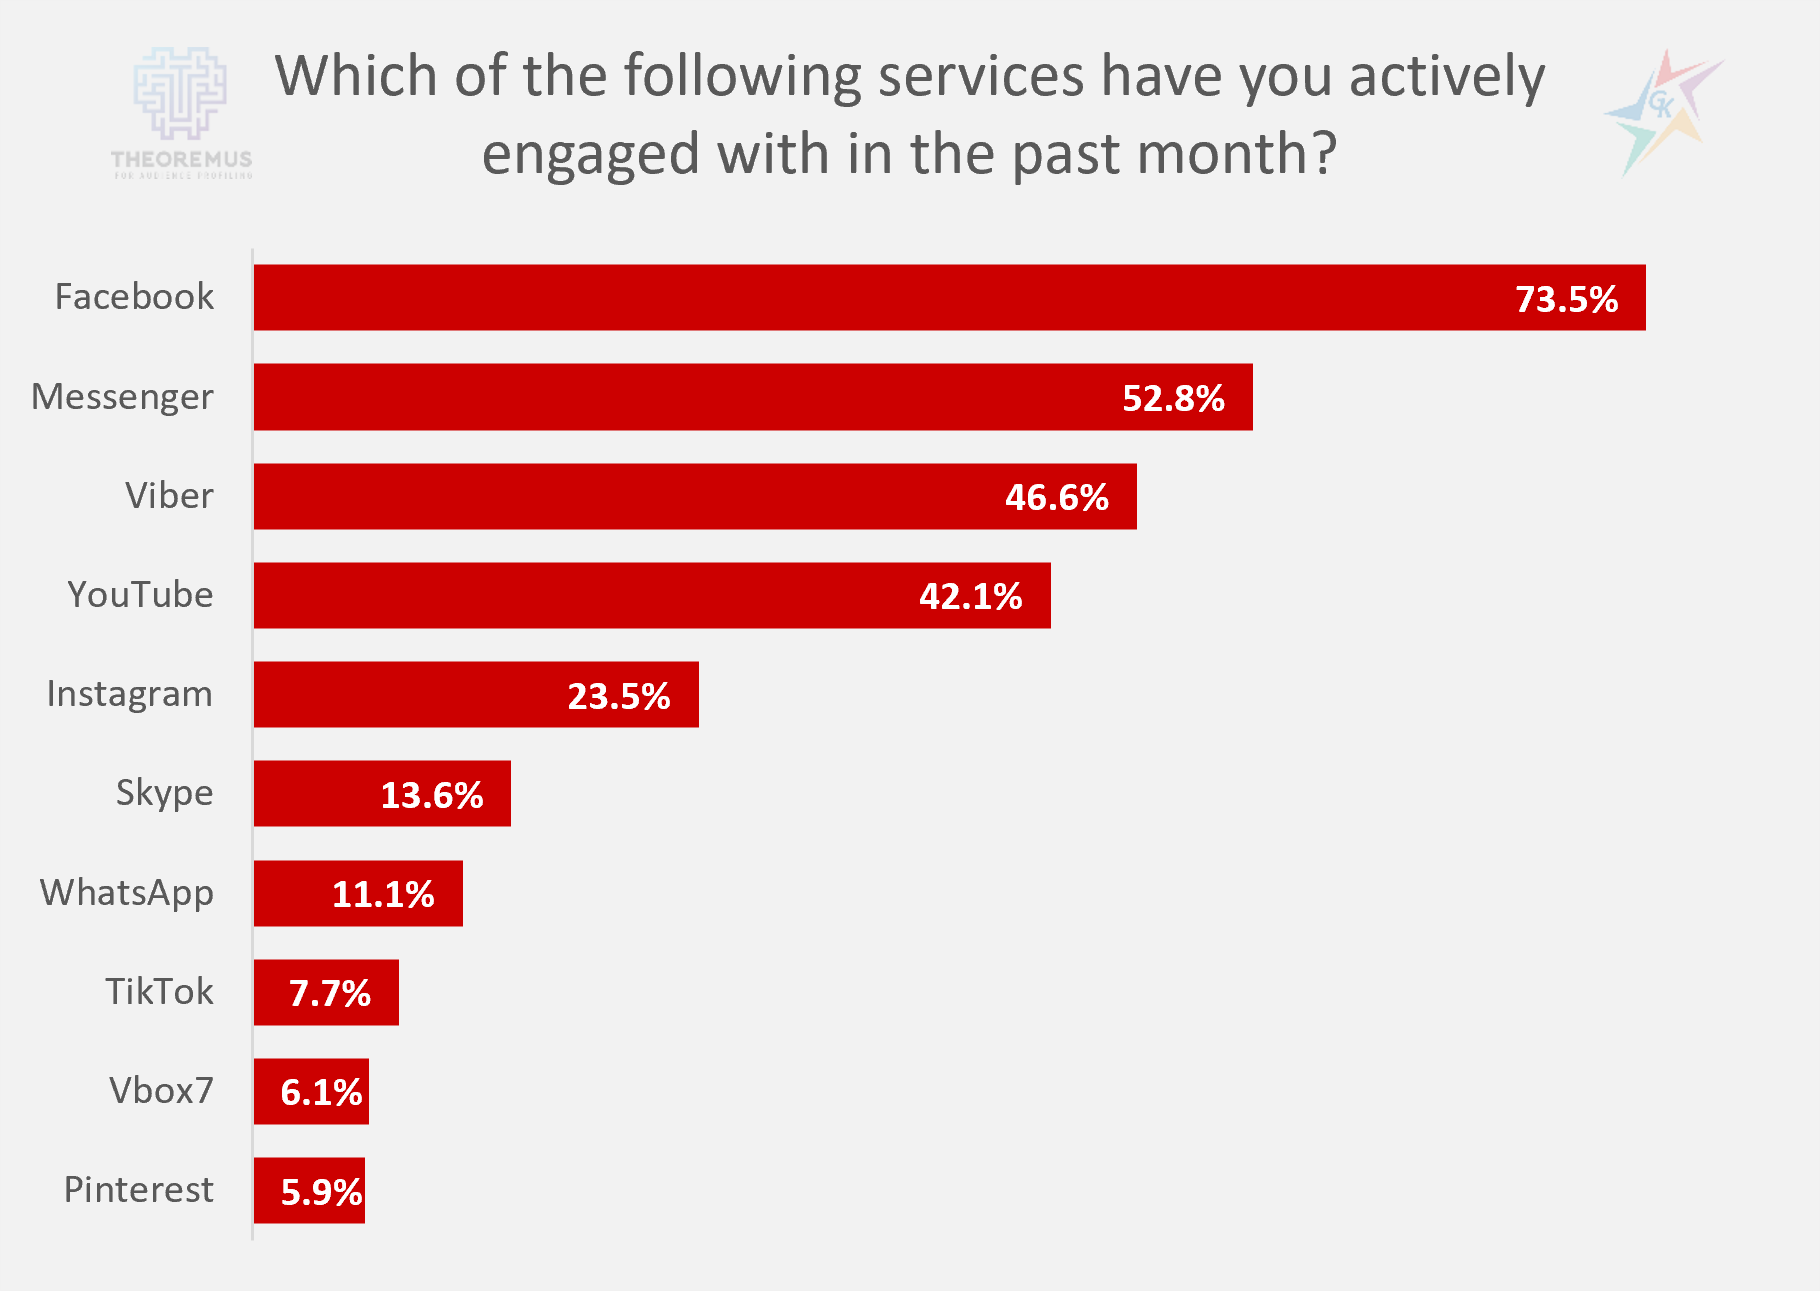
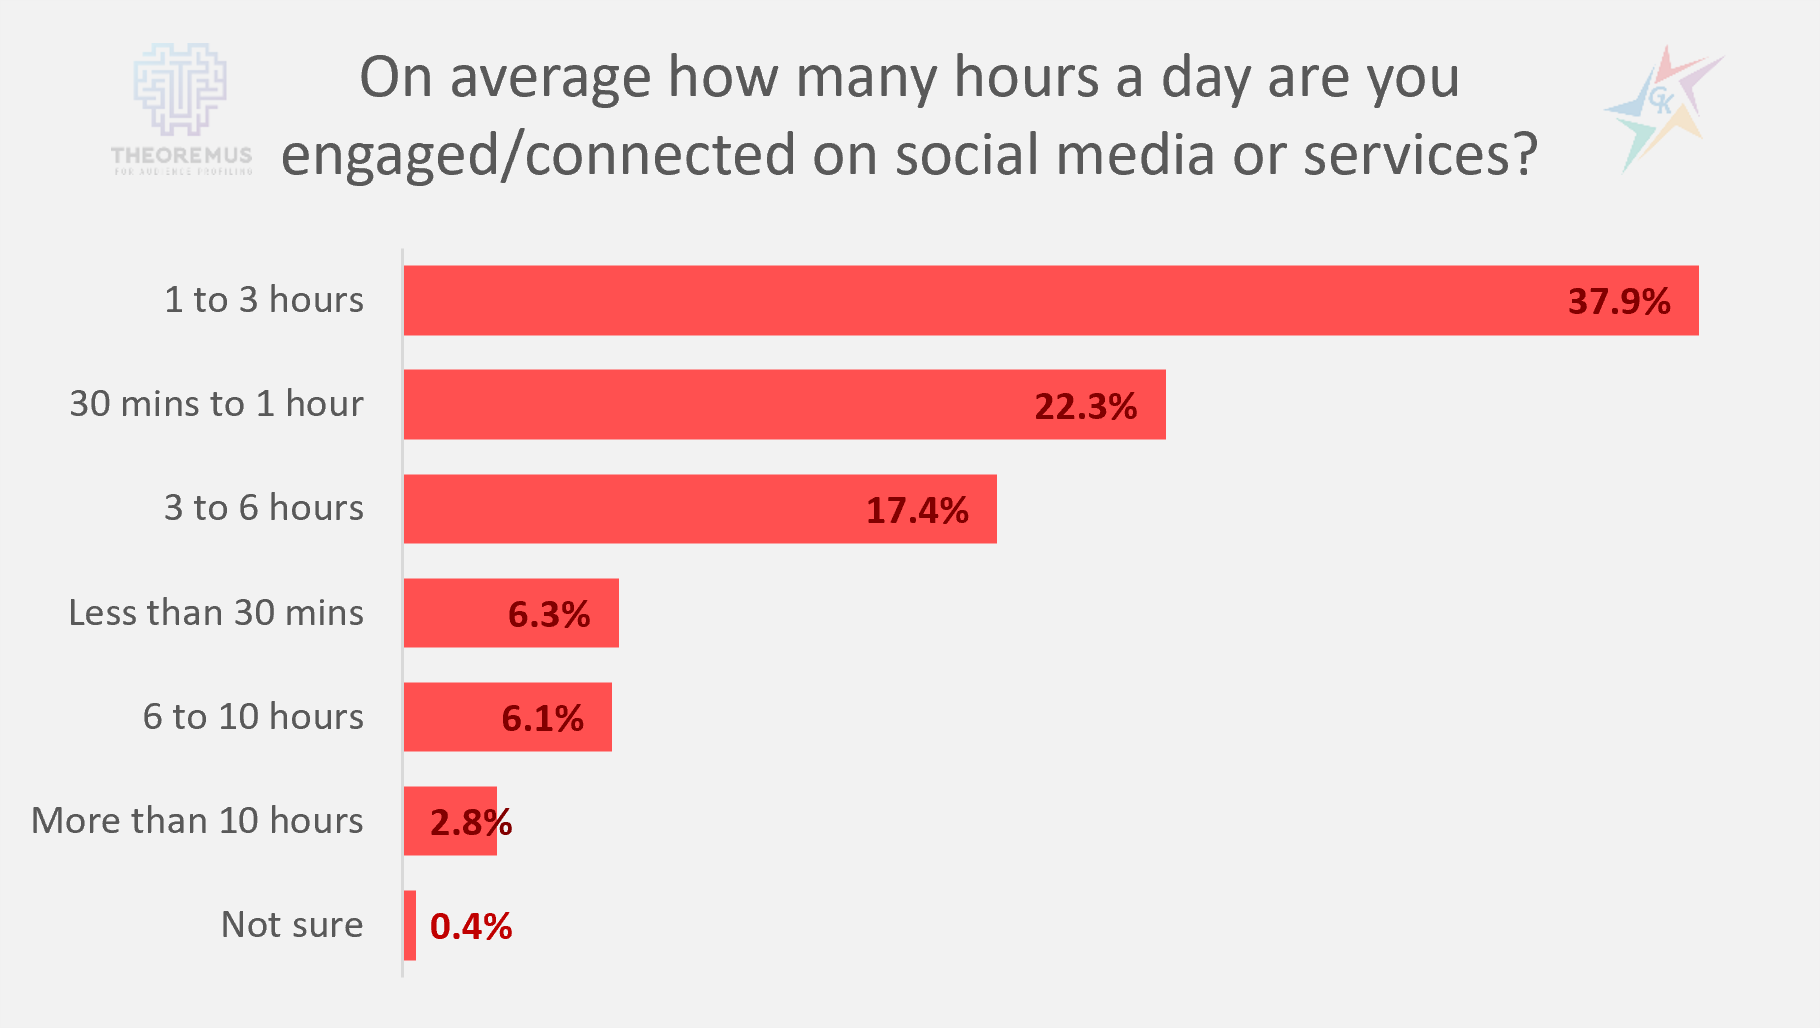
73.5% of the audience say that they are active users of Facebook, and 52.8% are users of the specially developed chat system to it – Messenger. Their main competitor Instagram ranks fifth with 23.5%, which confirms the opinion that the platform is less popular in our country for the broad target group for which the data are representative. Most people spend on average between 1 and 3 hours a day on social media, and the share of people who spend between 3 and 6 hours a day is not small – 17.4%.
Our team remains at your disposal to provide additional information about Theoremus, as well as to prepare specific analyzes upon your request. For additional information, please contact our team via the contact form.