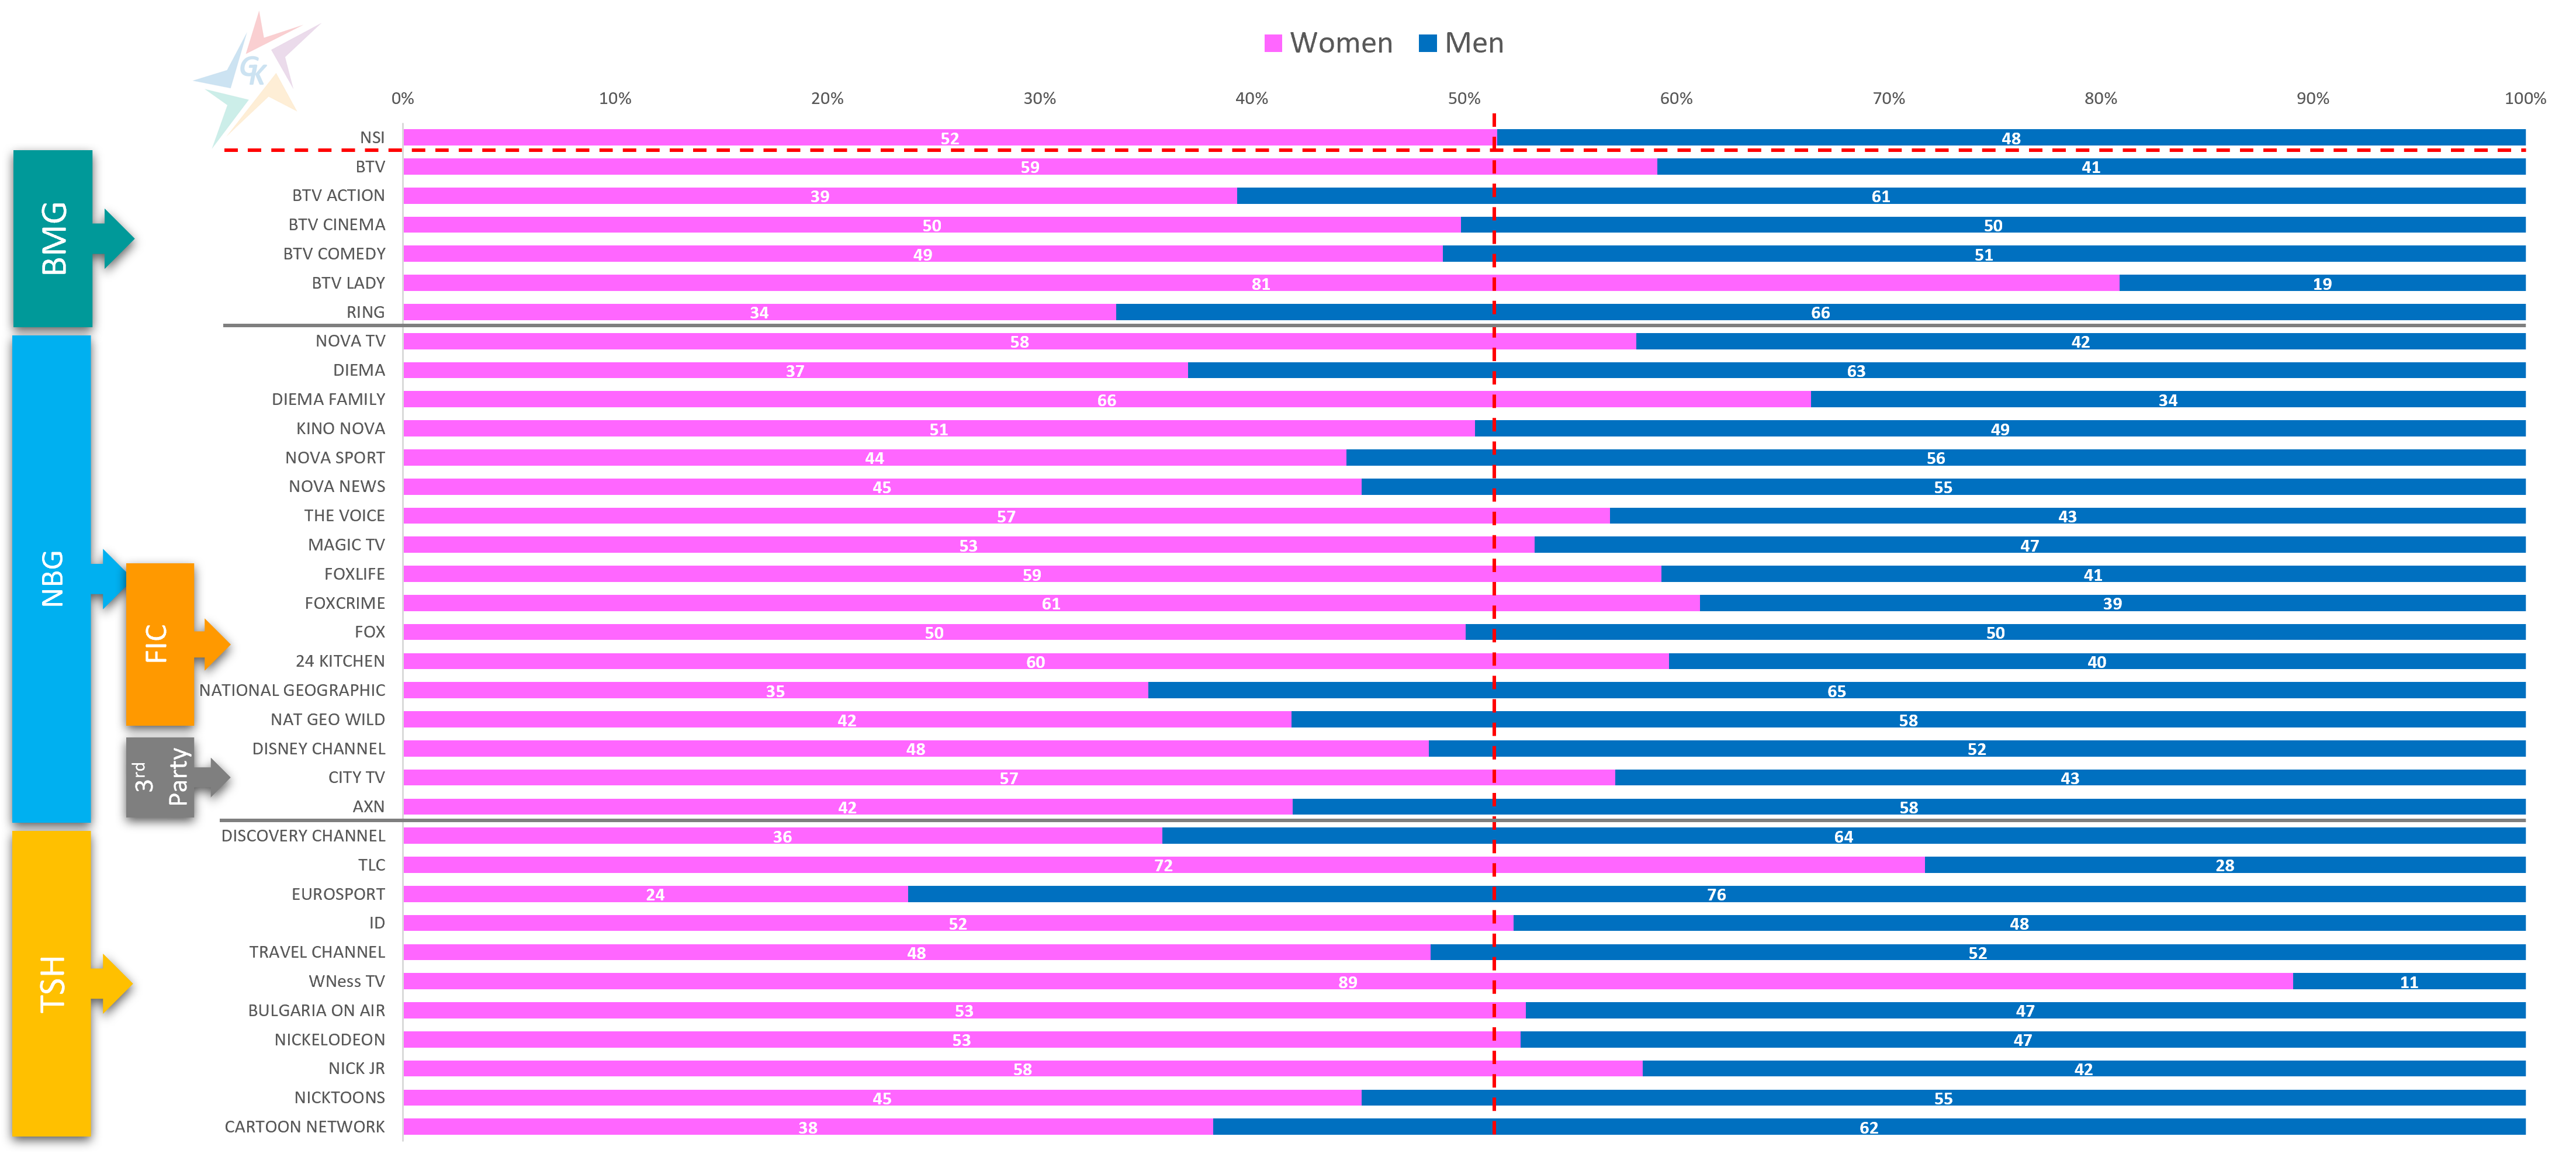
Good knowledge of the content and audience profile of TV channels is a key factor in building a successful strategy and campaign in this media channel. The dynamic environment in which we find ourselves leads to constant changes in program schemes, and sometimes in the mix of channels in the portfolio of large media groups. To meet a wide range of interests, the media often resort to tactical actions, which affect the percentage of different viewer groups within the channel, the so-called audience profile. Therefore, to successfully predict and plan TV campaigns, it is necessary to track and analyze the audience. In this topic we present an up-to-date look at the audience profile of the channels of the largest TV groups in the first seven months of 2021. In the first graph we illustrate the ratio between women and men among the viewers of the observed TV channels:
It is evident that among the three main national televisions, BNT 1 enjoys the greatest interest among men – 52%, which is almost 4% above the officially announced by NSI data for 2020. bTV and Nova TV have a predominance of female audiences, respectively 59% and 58%. These results are partly explained by the EURO2020 football championship, which started in June and gathered a large number of men in front of TV screens. In the period between 11th June and 11th July 2021 the average percentage of the male audience in BNT 1 rises to 59%, and in BNT 3, broadcasting in parallel with BNT 1 sports events – up to 70%.
Niche channels with predominance of female profile are WNess TV (89%), bTV Lady (81%), TLC (72%), Diema Family (66%), FOX Crime (61%), BNT 2 (61%), 24 Kitchen (60%). The channels that orient its content to a male audience are Eurosport (76%), RING.BG (66%), National Geographic (65%), Discovery Channel (64%), Diema (63%), BNT 3 (62%), bTV Action (61%).
Another commonly used criterion for segmenting TV channels is based on place of living:
On the chart, viewers are split into four groups – living in Sofia, in large cities with a population of over 100 thousand people, in small towns with a population of less than 100 thousand people and inhabiting villages. The channels with the largest share of viewers from the capital are – Magic TV (39%), Bulgaria On Air (32%), City TV (29%). Among the people from the big cities with the highest share are The Voice (35%), City TV (28%), AXN (26%), National Geographic (26%), and from the smaller cities – WNess TV (51%), BNT 4 (49%), Diema (47%), bTV Lady (43%), FOX Life (43%). The channels with the highest share of people from the villages are ID (45%), Nova Sport (41%), Nickelodeon (40%), Diema Family (39%). Among the three main national TV channels, bTV has the highest share of viewers from the villages, equal to 31%, which is more than the average for the country, reported by NSI- 27%.
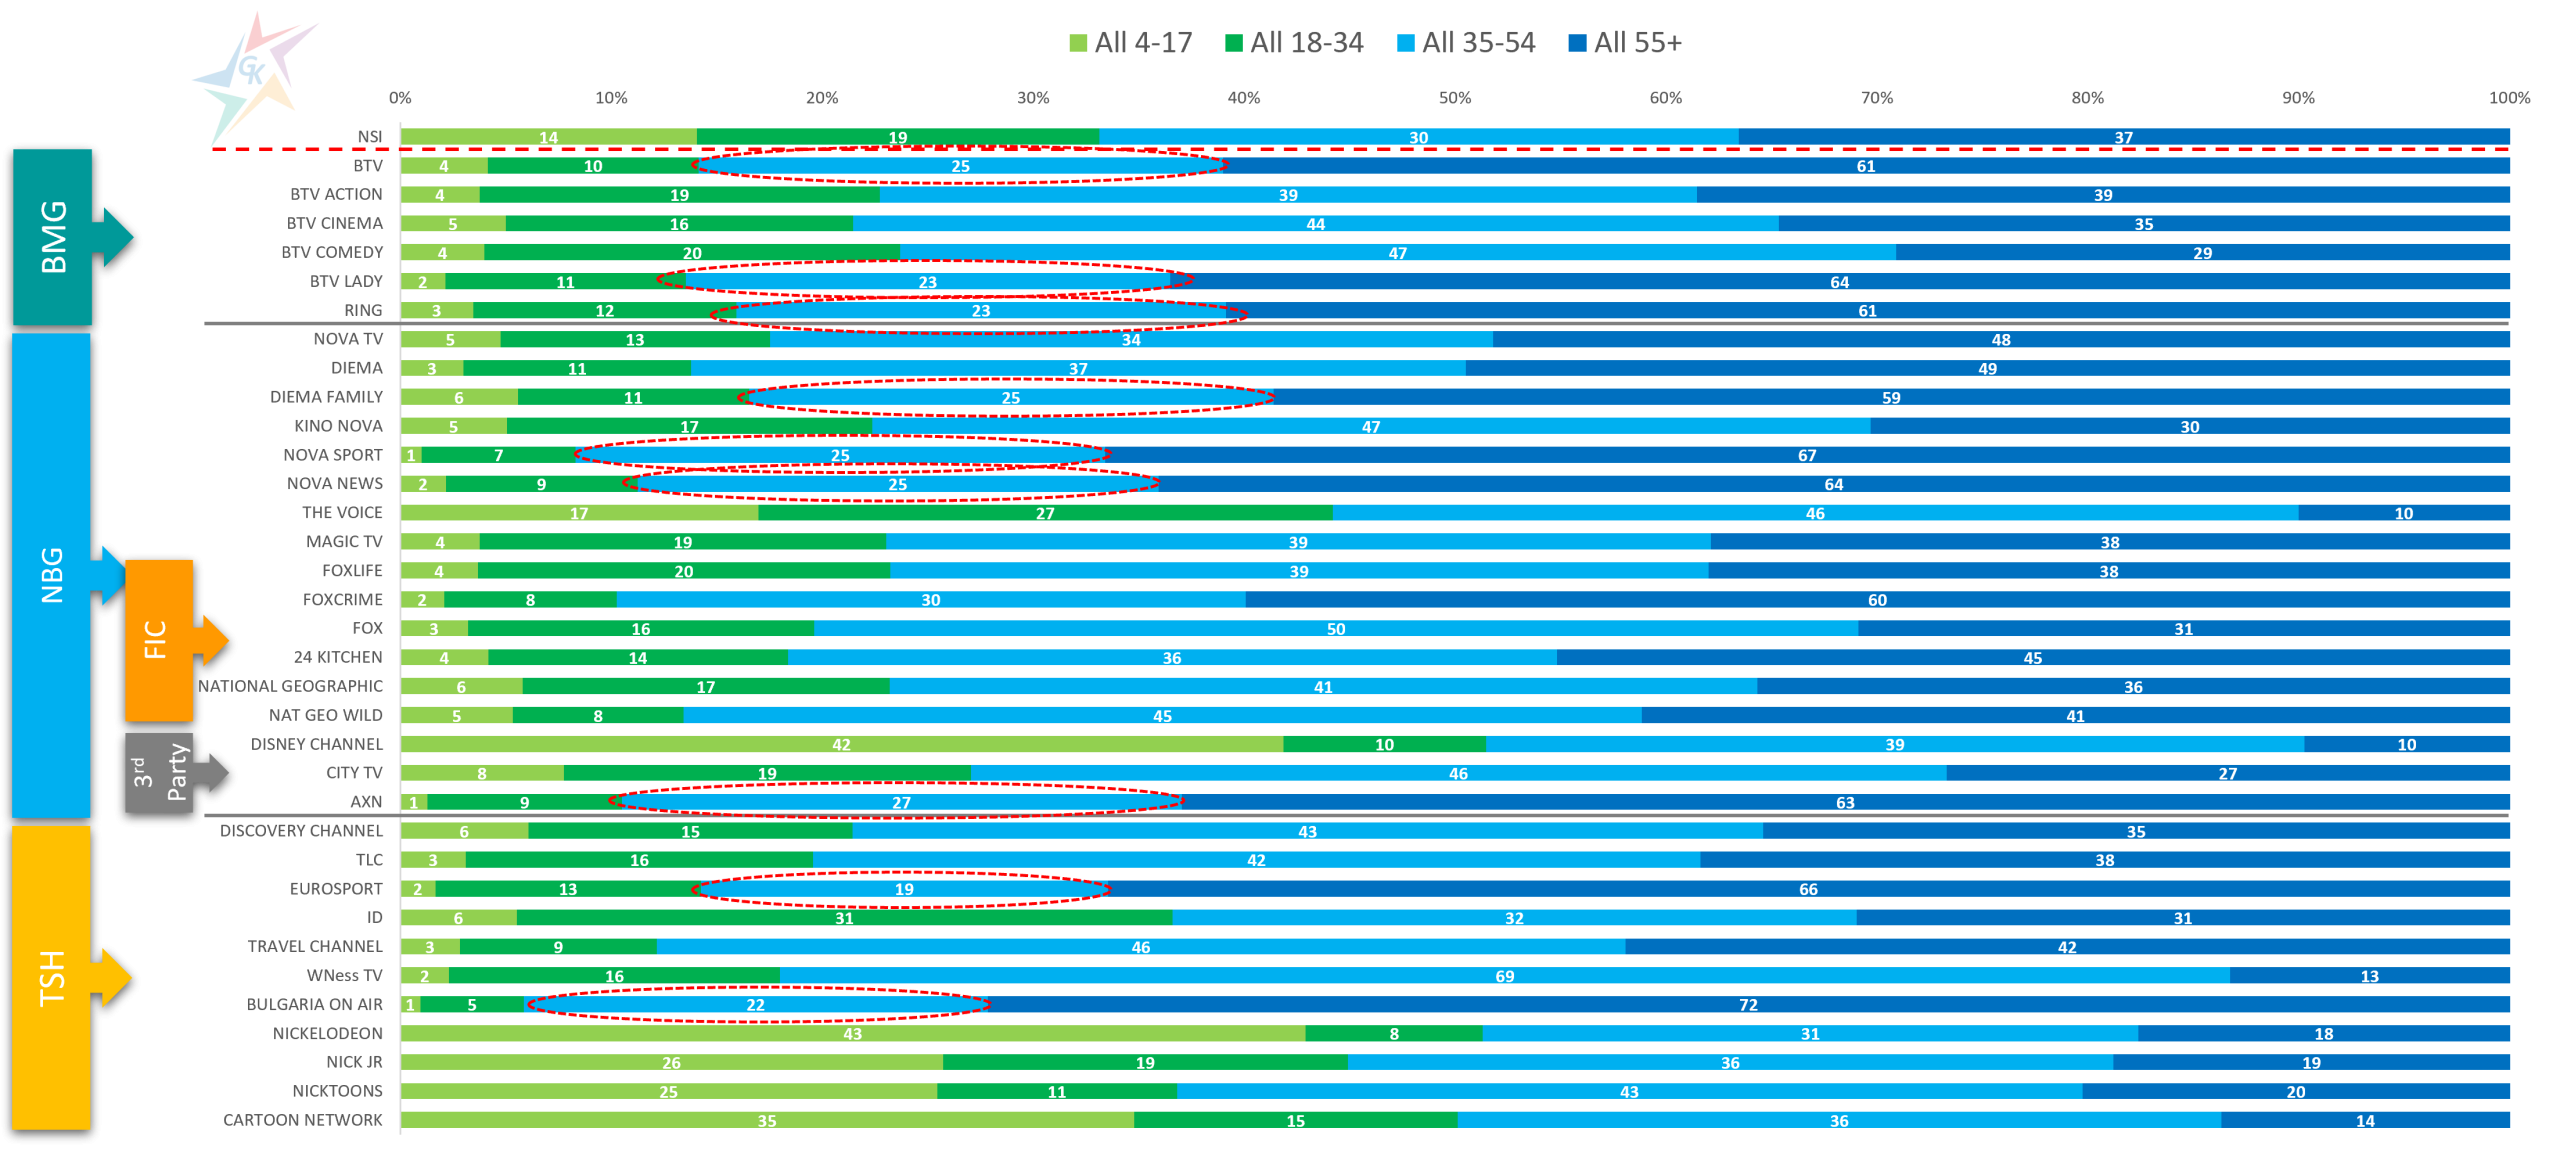
The following chart shows the profile of TV channels by age segments:
The results are logical for children aged between 4 and 17 years. The largest share of representatives of this group are kid’s channels, namely Nickelodeon (43%), Disney Channel (42%), Cartoon Network (35%). Distinctive with a high percentage of viewers between 18 and 34 years of age are ID (31%), The Voice (27%), bTV Comedy (20%), FOX Life (20%). According to national statistics in 2020, people aged between 35 and 54 represent 30% of the country’s population. According to the data in the chart, most of the people in this group find interesting TV content and represent a significant part of the audience of channels such as WNess TV (69%), FOX (50%), bTV Comedy (47%), Kino Nova (47%). Among the four analyzed groups, the largest segment of the population is occupied by people over the age of 55 – 37%. The TV channels that are characterized by the highest percentage of viewers of this group are BNT 2 (74%), Bulgaria On Air (72%), BNT 4 (70%). It is an interesting fact that among the three main national channels with the smallest share of people over 55 is Nova TV (48%). BNT 1 and bTV are represented with an equal percentage of people of this target group – 61%.
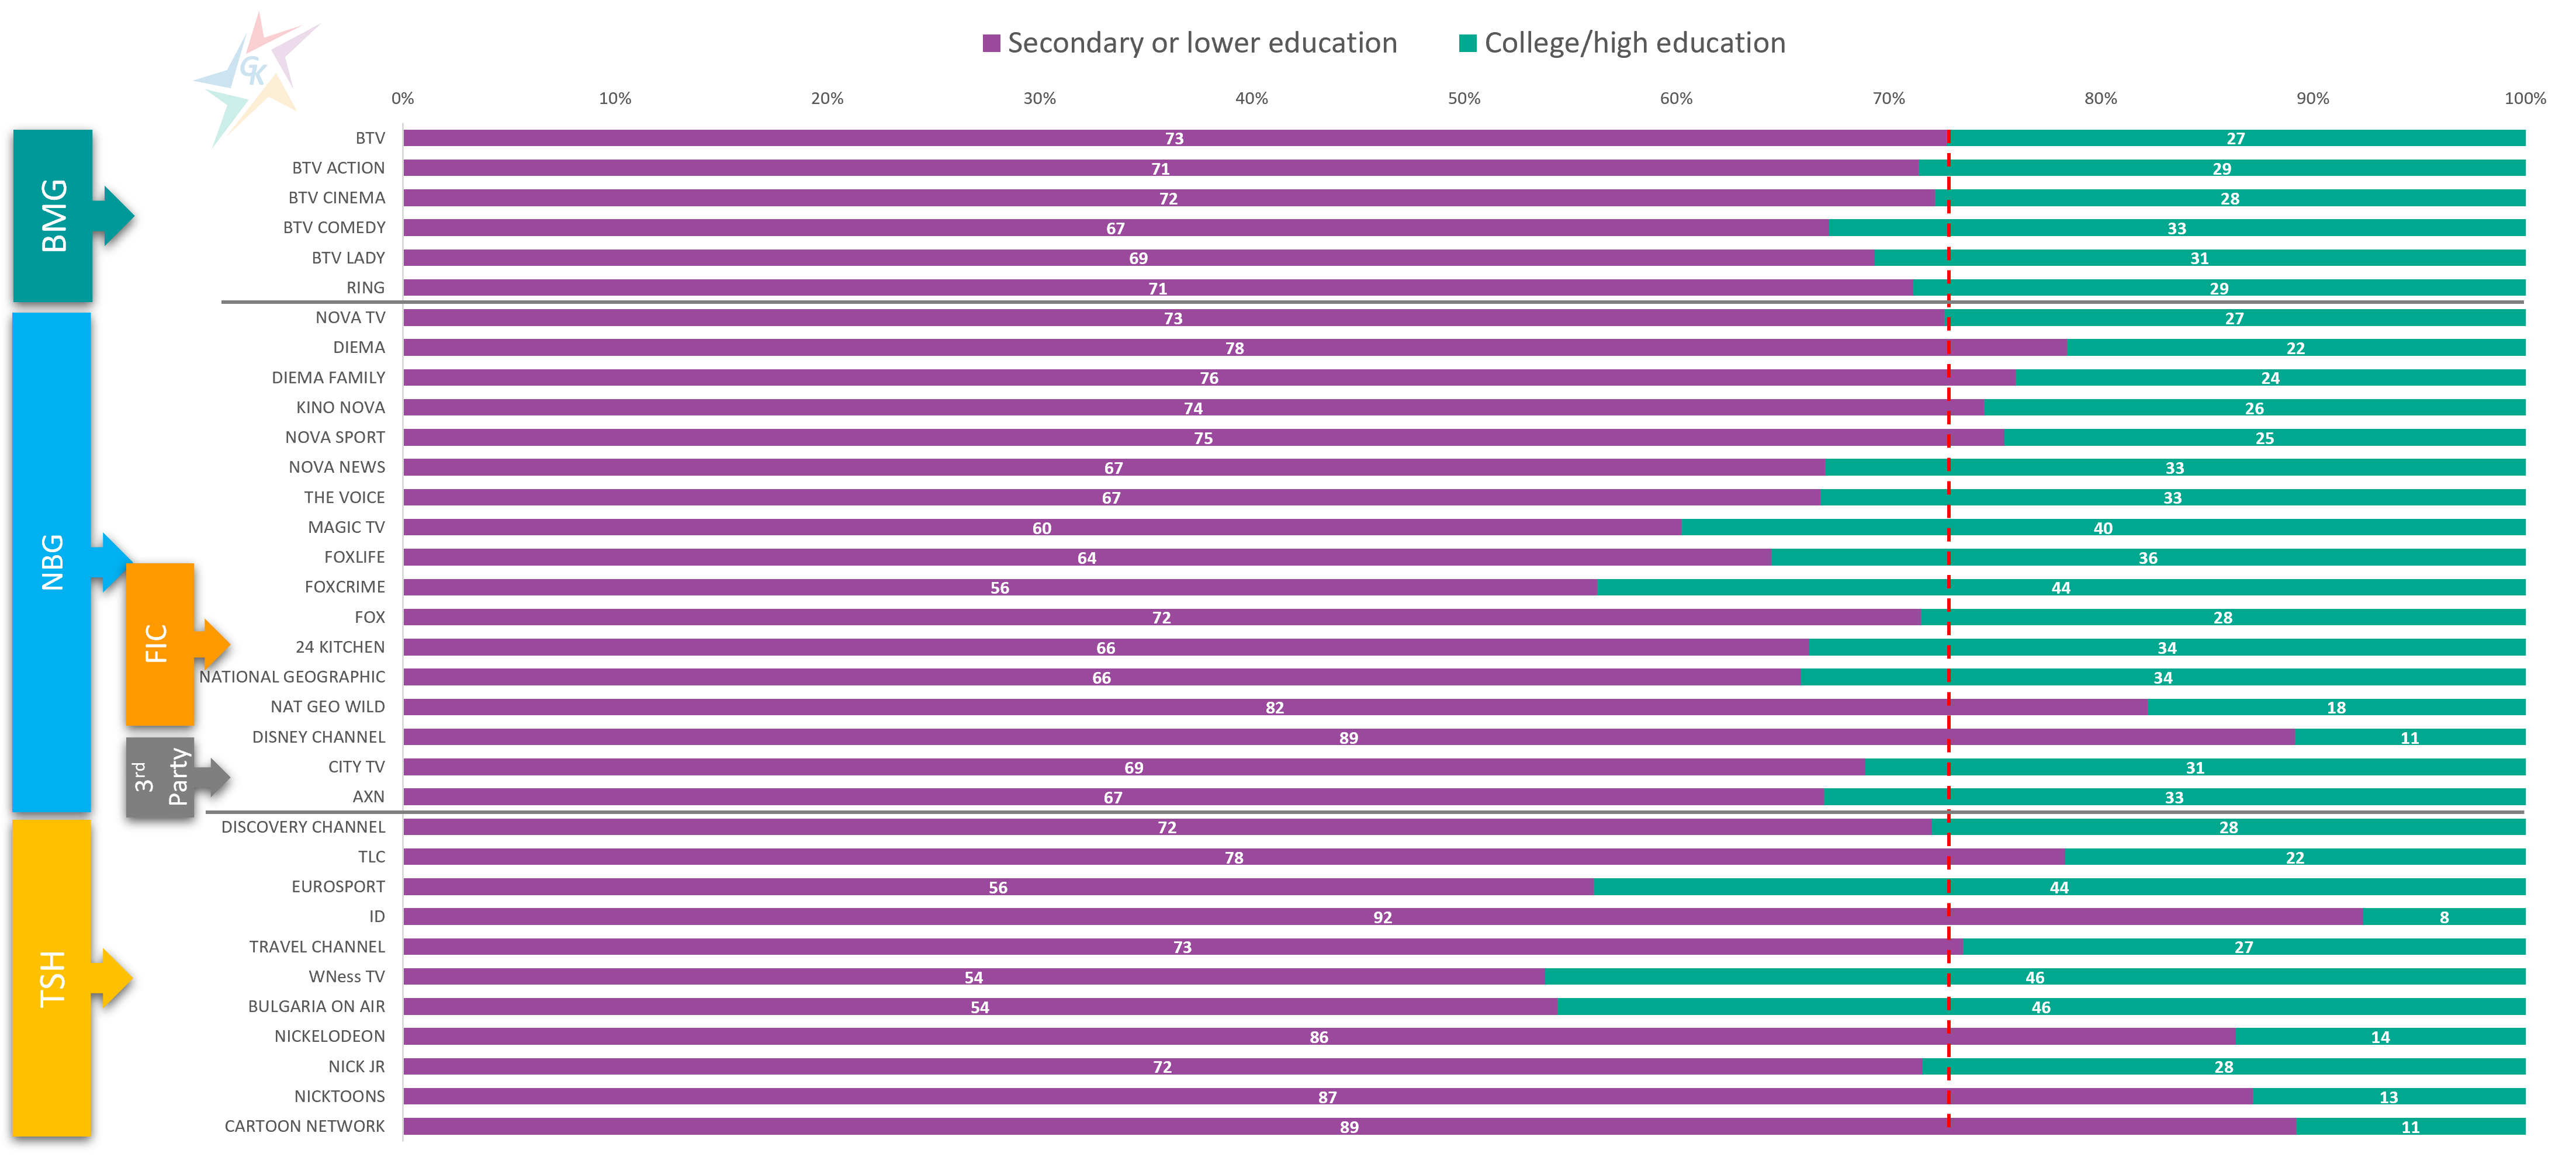
Another criterion that is often used in practice for profiling the audience of TV channels is the degree of completed education. The following chart shows the split of viewers between secondary or lower education graduates and those with higher level of education:
TV channels with the highest share of viewers who have higher level of education are WNess TV (46%), Bulgaria On Air (46%), BNT 2 (45%). Audience with secondary or lower education predominates in ID (92%), Disney Channel (89%), Cartoon Network (89%), as well as other kid’s channels.
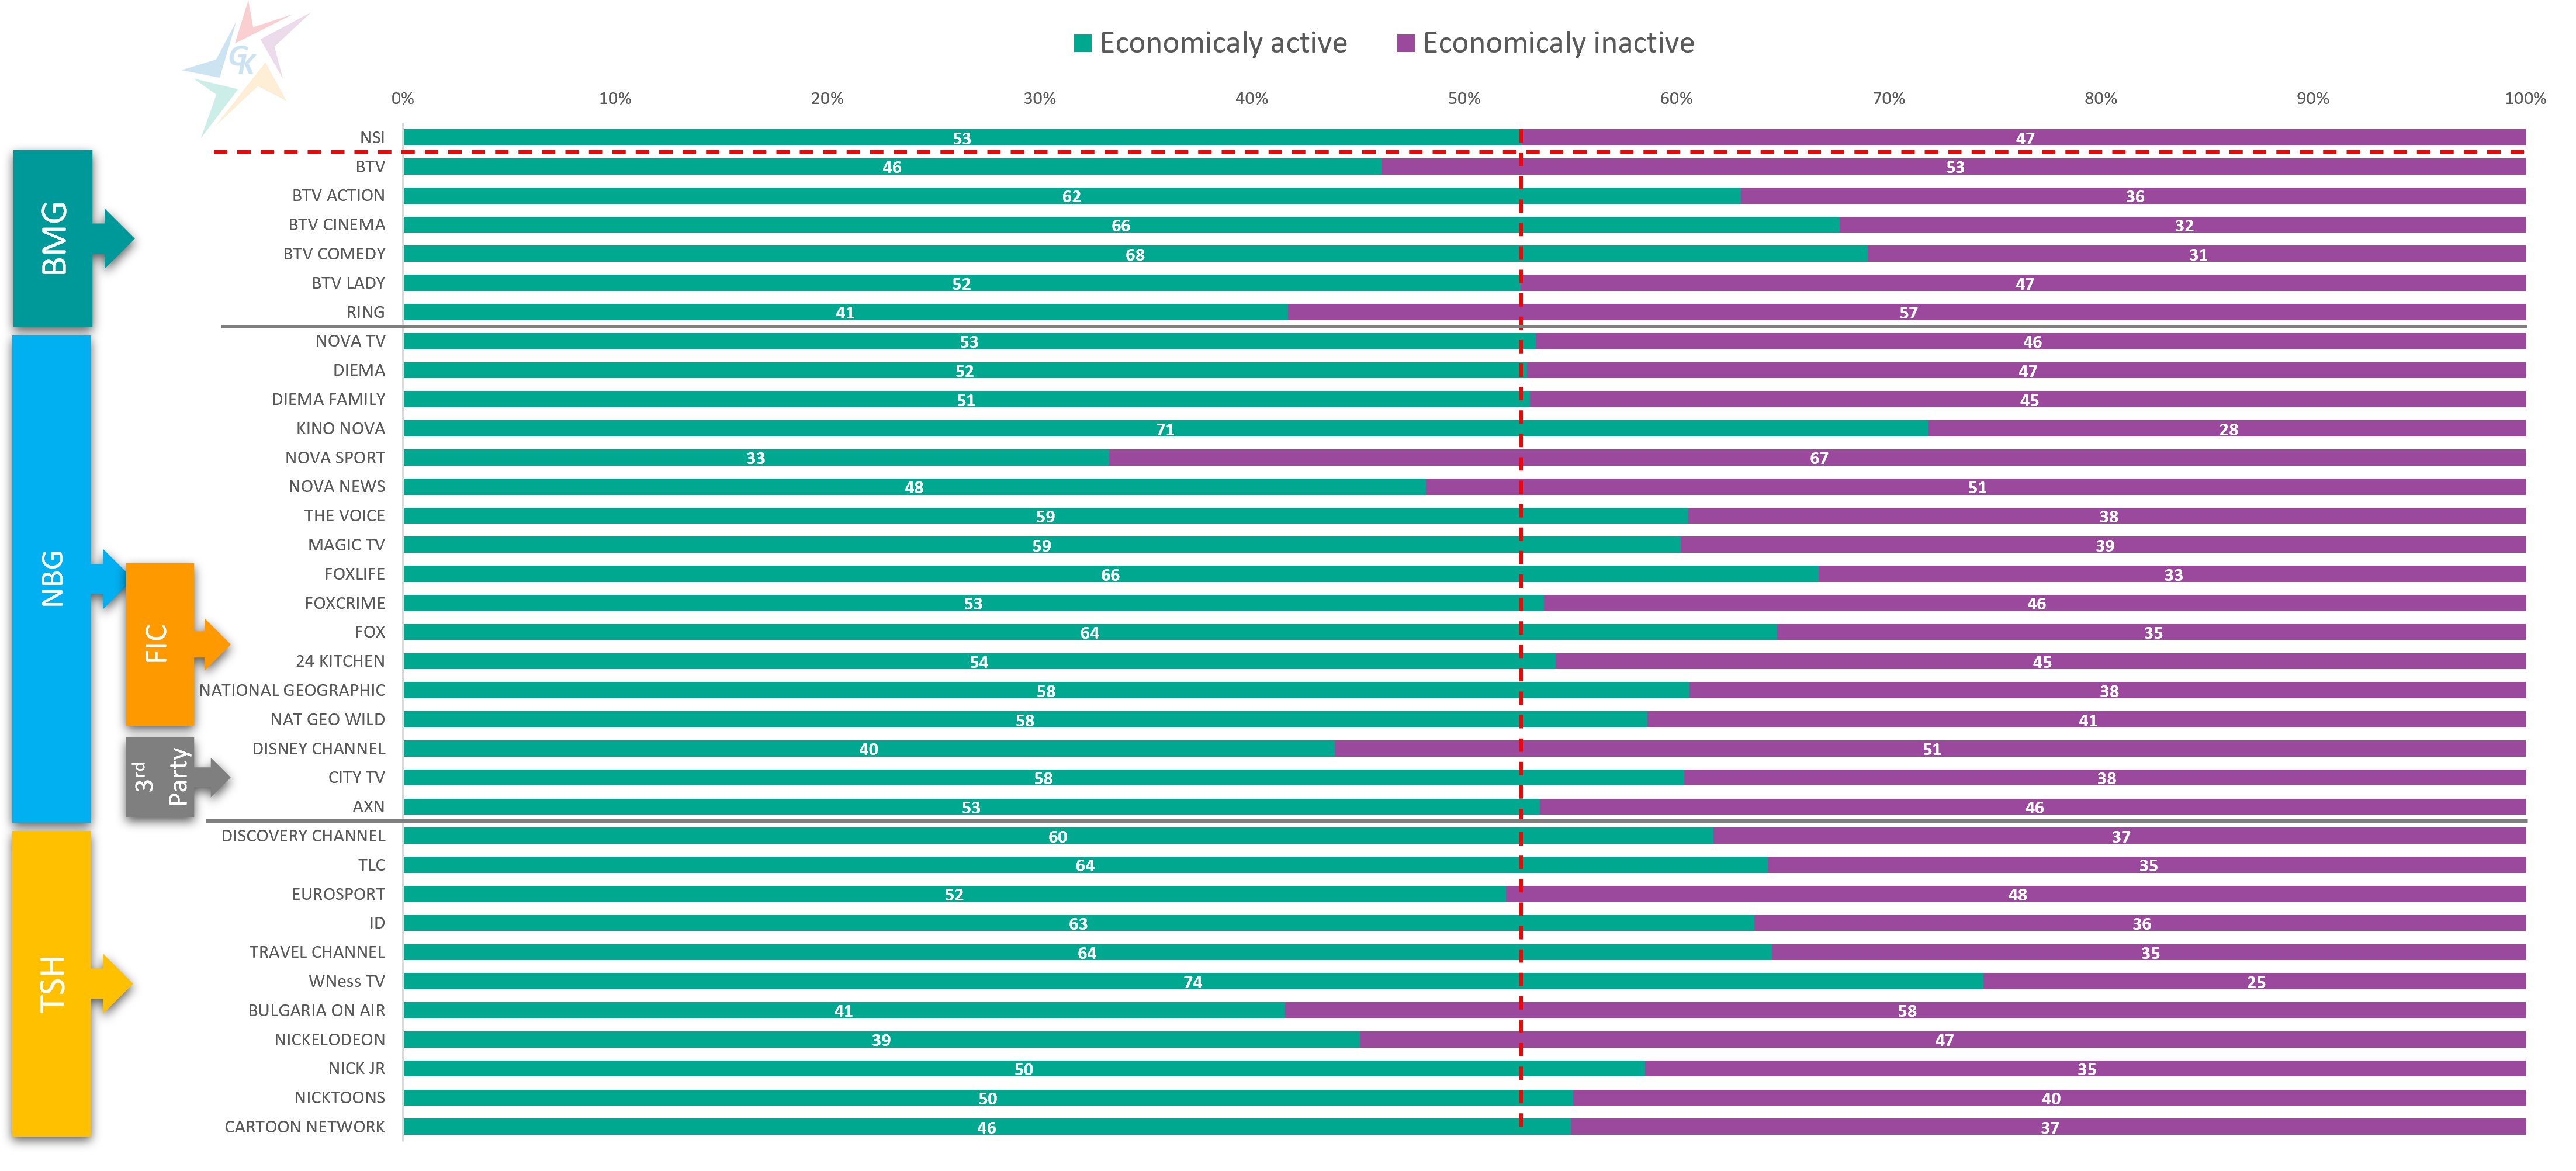
The last criterion we analyze in this topic is the economic activity of the viewers:
One of the most desired segments among advertisers is the economically active people. According to official statistics for 2020, this group of people represents 53% of the total population. The TV channels that are characterized by the highest percentage of economically active viewers are WNess TV (74%), Kino Nova (71%), bTV Comedy (68%), bTV Cinema (66%), FOX Life (66%), TLC (64%), FOX (64%), Travel Channel (64%), ID (63%), bTV Action (62%), Discovery Channel (60%). Among the main national channels Nova TV has the highest share of this audience segment – 53%. bTV and BNT 1 have a value below the average for the country, reported by NSI.
For additional information, please contact our team via the contact form.
2021 started with high expectations for a rapid market recovery. The shock of the first wave of the pandemic was followed by the transformation and adaptation of the business to the new reality. The fall months of 2020 proved this by quickly catching up with pre-Covid television activity levels. This fact strengthened the positive attitude and optimistic forecast for the coming 2021. In this topic we follow whether these expectations are about to be realized through a less commonly used indicator to study the dynamics of TV market – the number of broadcast commercials.
On the chart we present the broadcast number of TV commercials in thousands – standard spots (positioned in an ad blocks) and alternative ad formats (positioned outside an ad blocks) in the last five years, divided by semesters. In addition, we track the average length of ad formats during the reviewed period. The analyzed data include TV channels with constant advertising monitoring for the observed period. Thus we exclude possible distortion of the data related to the change in the number of monitored TV channels and ensure comparability of the data. The analyzed alternative ad forms do not include the teleshopping.
The first thing that makes an impression on the chart is that the advertising activity in the second half of the year is more intensive for each of the considered years. In 2020, this difference reaches its highest value, and the data show that 37% more advertising messages were broadcast compared to the first half of the year. One of the main reasons for this is the extraordinary epidemiological situation, which has stopped a number of campaigns and reality and entertainment TV formats. Given this feature of the annual dynamics of broadcast advertising, we compared the data for the first half of this year with the same period in 2020 to get an idea of the trend. The comparison shows that the quantity of ads broadcast in the first six months of 2021 exceeds by 29.1% the quantity of ads broadcast in the first half of the last year. Standard TV spots also increased by 29.0% and non-standard ad formats by 33.5%.
The result is in line with optimistic forecasts, but can we compare H1 2021 to pre-pandemic levels? The report shows that the first half of this year is still “catching up” with the results of the strong in terms of advertising 2019, reporting 6.8% fewer ads. There is also a lag of 4.5% when comparing the results with the first half of 2018, which means that the recovery of the advertising market will take longer.
The described conclusions can be supplemented with information about the share of alternative advertising forms. The figures show that 2016 was the most successful for alternative advertising reaching the highest percentage of total activity – 3.8%. Over the next three years, this share was relatively constant in the range of 2.6% ÷ 2.7%. In 2020, because of the pandemic, its share dropped to 2.2%. In January-June 2021, non-standard advertising forms increased again and returned to pre-pandemic level – 2.7% share of total TV ads.
From the presented graphics we can make a curious conclusion about the average length of the broadcast advertising messages. If in 2016 the average length is 23.1 seconds, then over the years it gradually decreases and for the first half of this year is already 21.0 seconds. One possible reason for advertisers to prefer shorter forms of advertising is the annual inflation in television advertising rate cards. Another likely reason for the reduction in the length of advertising messages is the global trend of reducing the time in which viewers remain focused on the content they watch.
For additional information, please contact our team via the contact form.
Defining the target audience and information about its attitudes, preferences and consumption in the broadest sense are key elements in building a communication strategy. The choice of media and means of expression, as well as the specific messages with which to achieve the set goals of the campaign depend on them. The dynamic environment in which we find ourselves often changes consumer attitudes, creates the need for new products and services and eliminates the need for existing ones. External factors make it difficult for marketers to build and analyze a target group. That is why specially developed software comes to the rescue, which by processing a series of questions and answers explores the attitudes of the audience and discovers hidden patterns of behavior. The purpose of this topic is to introduce you to a little known but very useful platform Theoremus. The system is similar to TGI data, which is not presenting on the Bulgarian market for years, and provides answers to a number of questions, related to the knowledge of the audience and the ability to build its profile. The survey is web-based and is conducted on regular waves. The panel contains information on the urban population aged between 16 and 65 and links to the data officially submitted by the NSI. The data in the Theoremus platform are representative for 3,421,684 Bulgarians, and the possibility to define a target group offers many criteria, such as age, gender, income, marital status, personal interests. One of the advantages of the software is the ability to directly compare between the target groups, thus easily detecting dependencies in the similarities and more importantly – the distinctive features of each. The panel is made up of 1,100 respondents and covers over 670 diverse questions, divided into several sections – demography, lifestyle, devices used, technological and digital activity, finance, shopping, transport and travel, food and drink, traditional and social media, awareness of the brand. In addition to a wide range of questions, the platform provides an opportunity to analyze the answers among a wide range of brands in the following areas:
Media: social media, TV channels;
Financial institutions: banks, fast loans;
Insurance and commercial companies;
Drinks: beers and ciders, soft and alcoholic drinks, bottled water, coffee;
Cosmetic and sanitary products and oral hygiene products;
Medicines, food supplements, pharmacies;
Household chemistry;
Pet food;
Retail chains and online stores.
In this way, Theoremus offers an in-depth analysis from different angles and provides specific answers to the audience’s attitudes. In addition to predicting the strength and importance of a product feature, data analysis allows us to identify emerging needs and trends among consumers. It is important to note that in addition to representative data, Theoremus also provides real-time control over the quality of the study. The questionnaire is filled in online and is completely anonymous, and the system checks the time for which the respondent gave his answers and assesses the quality of the conducted interview.
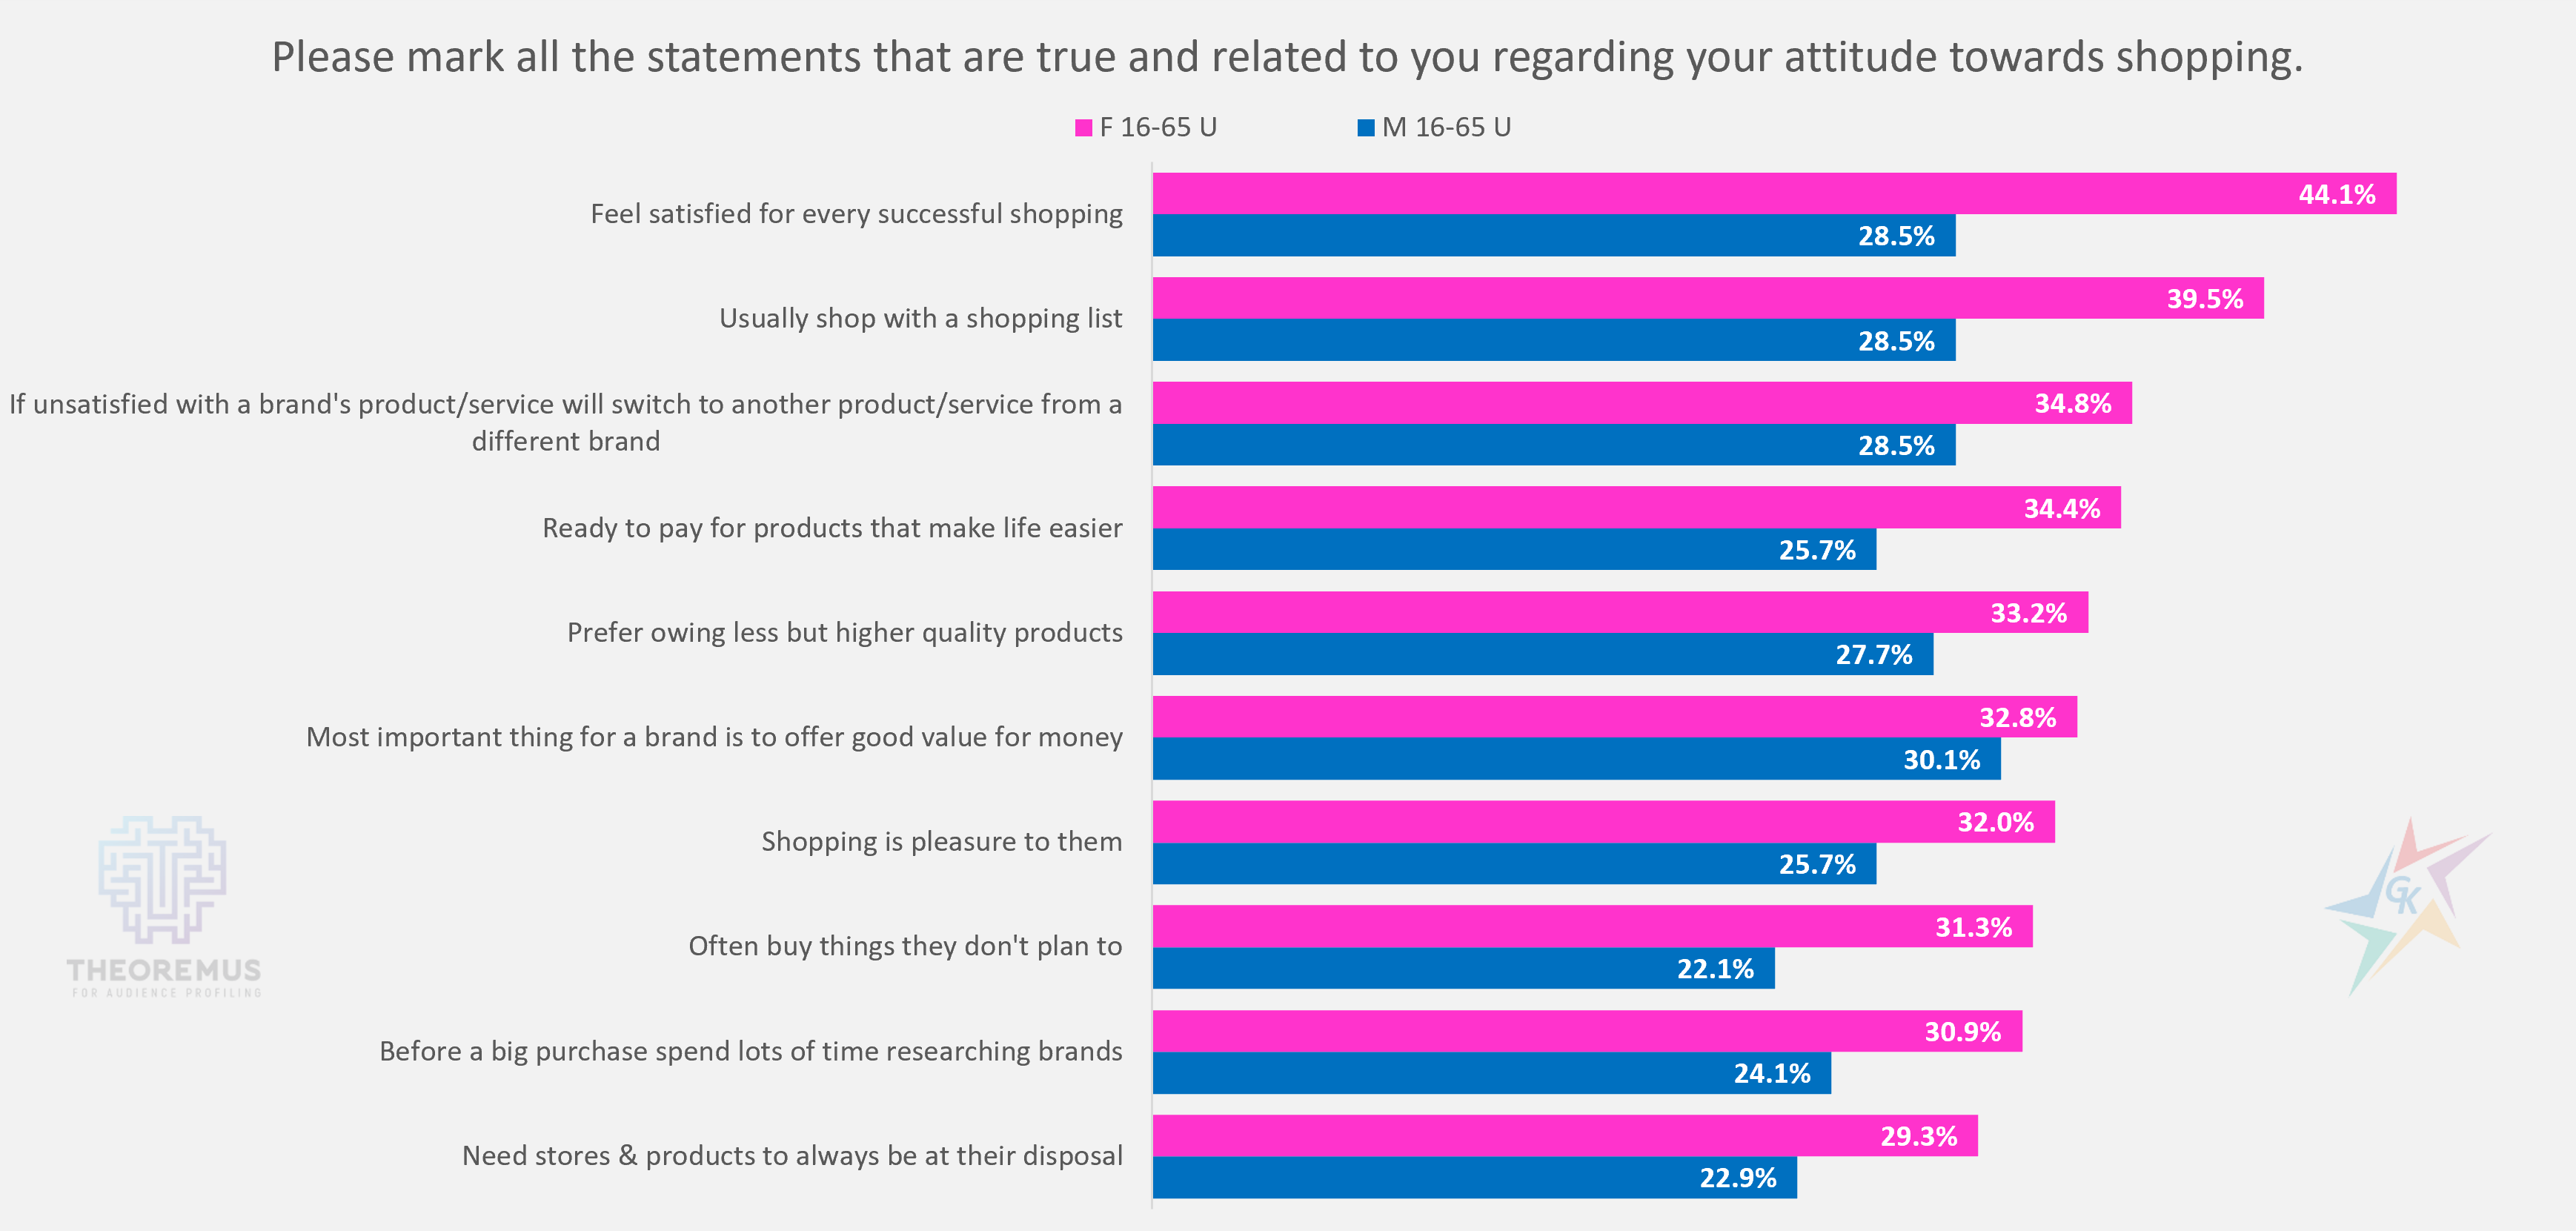
The first functionality of Theoremus, which we will consider in this topic, is the ability to compare between different target groups. To this end, we have selected some interesting questions related to everyday habits and we present to you the ten most frequently mentioned answers given by men and women between the ages of 16 and 65, urban population:
Source: Theoremus. Period: April 2021.
To the question “What do you do in your spare time?” Both, men and women, answer that they prefer to rest at home. Given the events of the past year and the fact that the survey was conducted in April 2021, the answer is no surprise. The differences are beginning to show in the subsequent possibilities. For example, for men among the most frequently mentioned options are “Play video games” and “Go fishing”, and for women – “Engage in DIY and decorations” and “Engage in arts”.
The most popular answers in terms of shopping, which, although it has become a routine for almost everyone, is characterized by established habits and perceptions of both genders are also interesting.
Source: Theoremus. Period: April 2021.
If men respond pragmatically and point out that the most important thing for a brand is to offer good value for money, then for women the feeling of satisfaction for every successful shopping is of paramount importance. Most of the female target group states that they shop with a list, but one of the statements they recognize as true is ” Often buy things they don’t plan to”.
In addition to the percentage ration of these responses, Theoremus also provides information on how distinctive a given characteristic is for the studied target group. The system calculates the distinctiveness of the options and gives them numerical expression. The higher the value of distinctiveness of a given answer, the more typical it is for the analyzed audience. For example, “Most important thing for a brand is to offer good value for money” (96) is the most distinctive answer for men. For women, the most typical answers are “Feel satisfied for every successful shopping” (121), as well as the statement that “Often buy things they don’t plan to” (117).
Source: Theoremus. Period: April 2021.
The considered examples are only highlights from the wide range of questions, answers and possible target groups for analysis provided by the Theoremus platform.
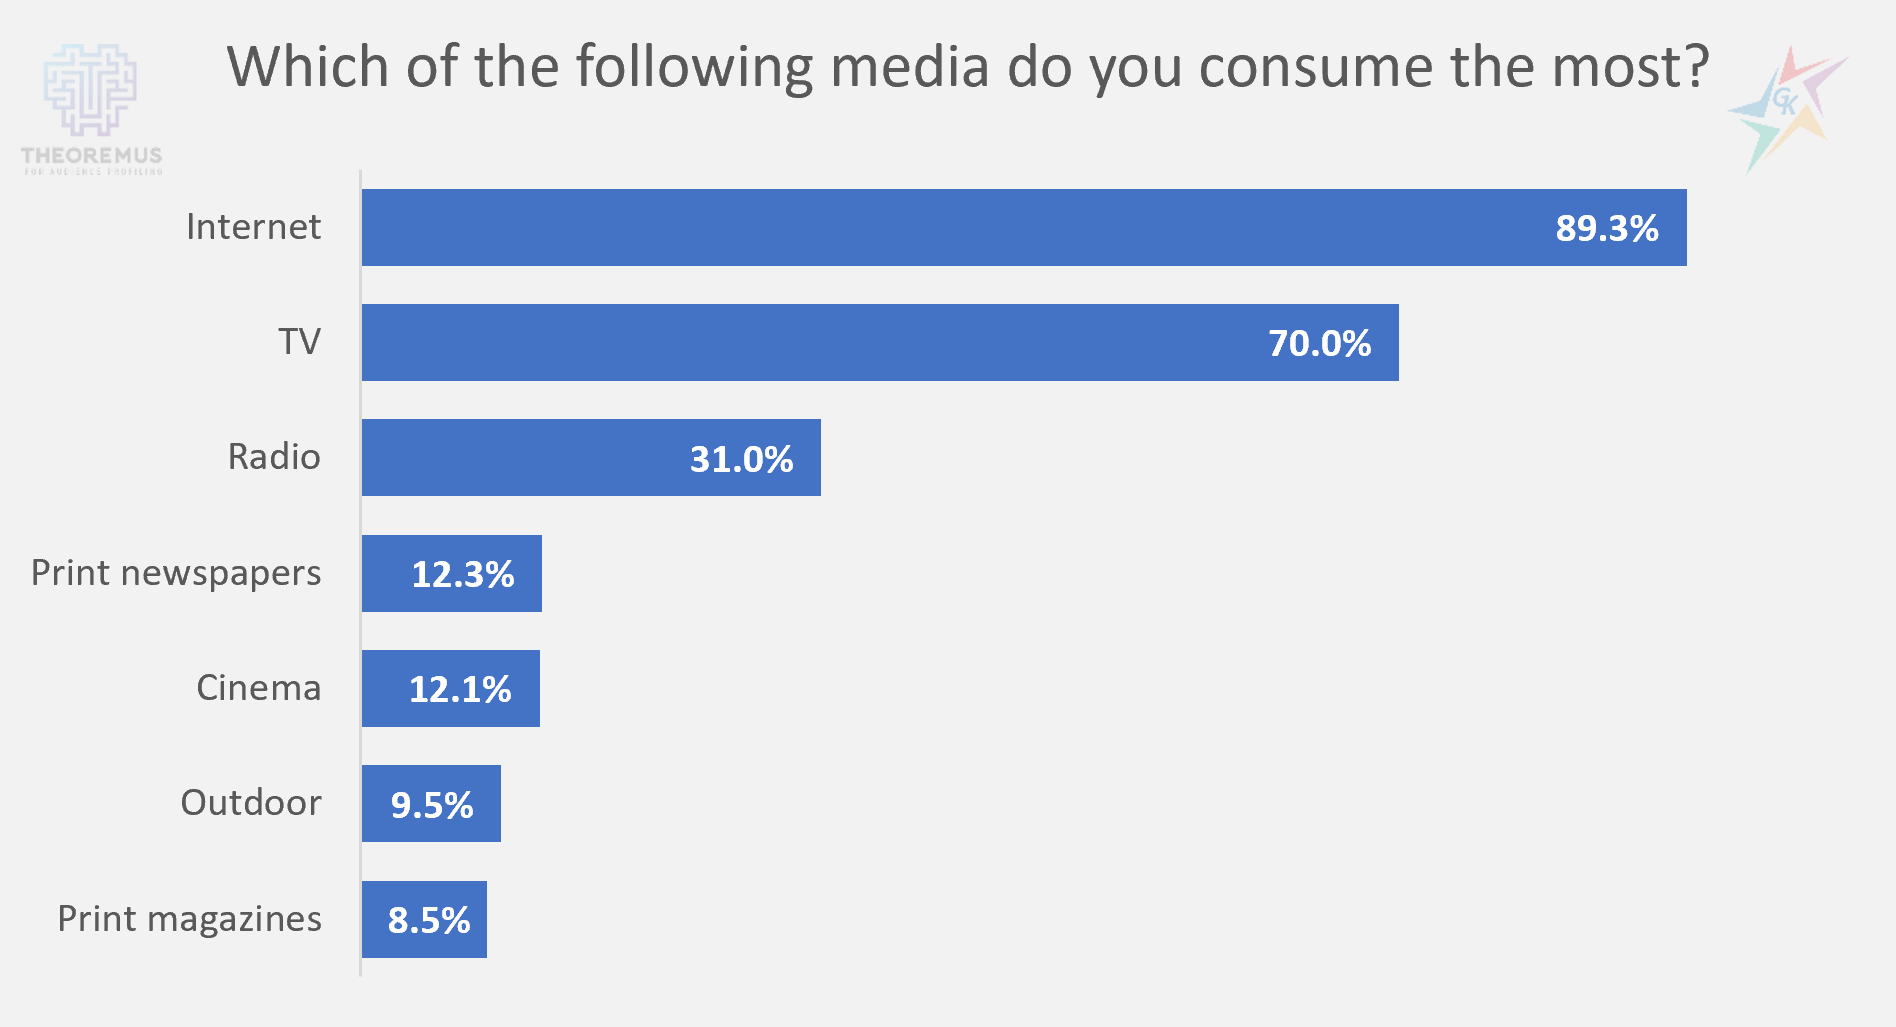
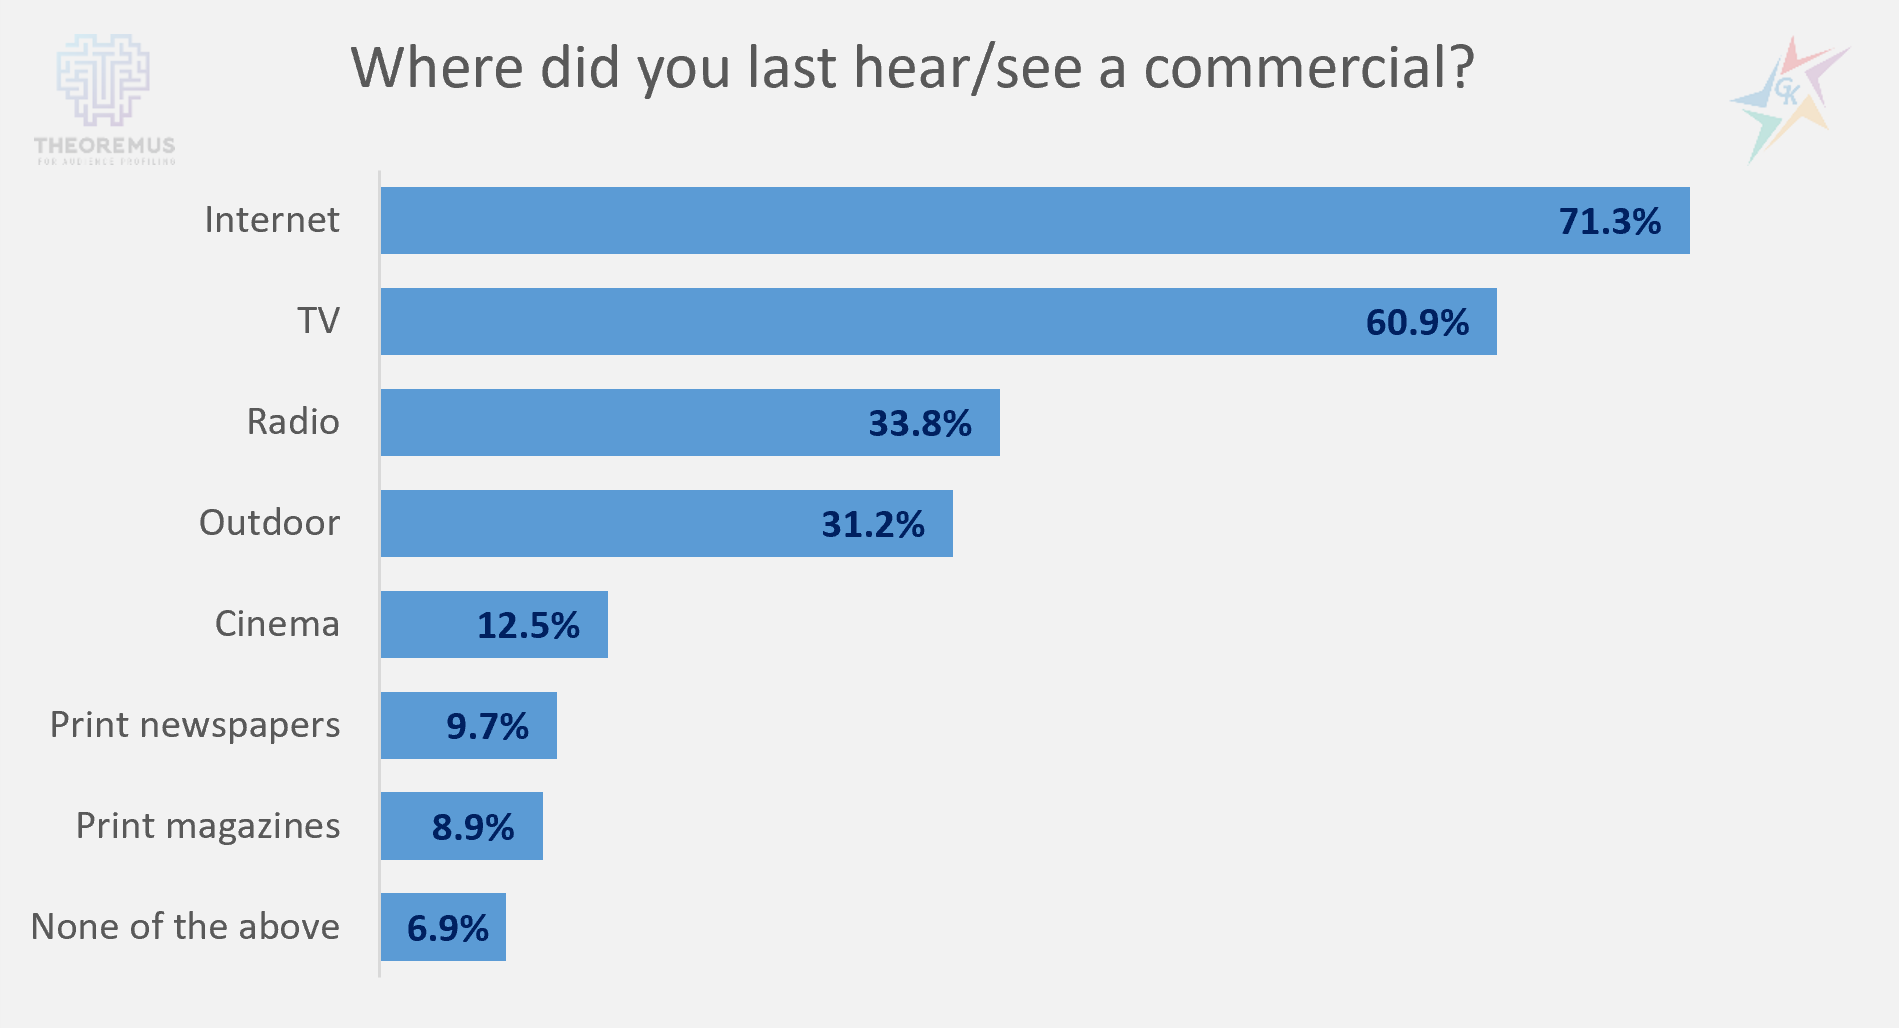
To illustrate other useful functionality, we present the most important answers to questions from the “Media” section:
The first chart shows ranking of the most frequently used media channels, and the second one reveals in which type of media the respondents last noticed an advertising message. Unsurprisingly, the answers reveal that the Internet and television are the media we resort to most often. The background noise created by these media channels is high and therefore the advertising messages in them often remain less noticeable to the audience. In contrast, radio advertising stands out more in the minds of the target group. To the question ” Where did you last hear/see a commercial? ” 33.8% answered on radio, and 31% answered that radio is one of the most frequently consumed types of media.
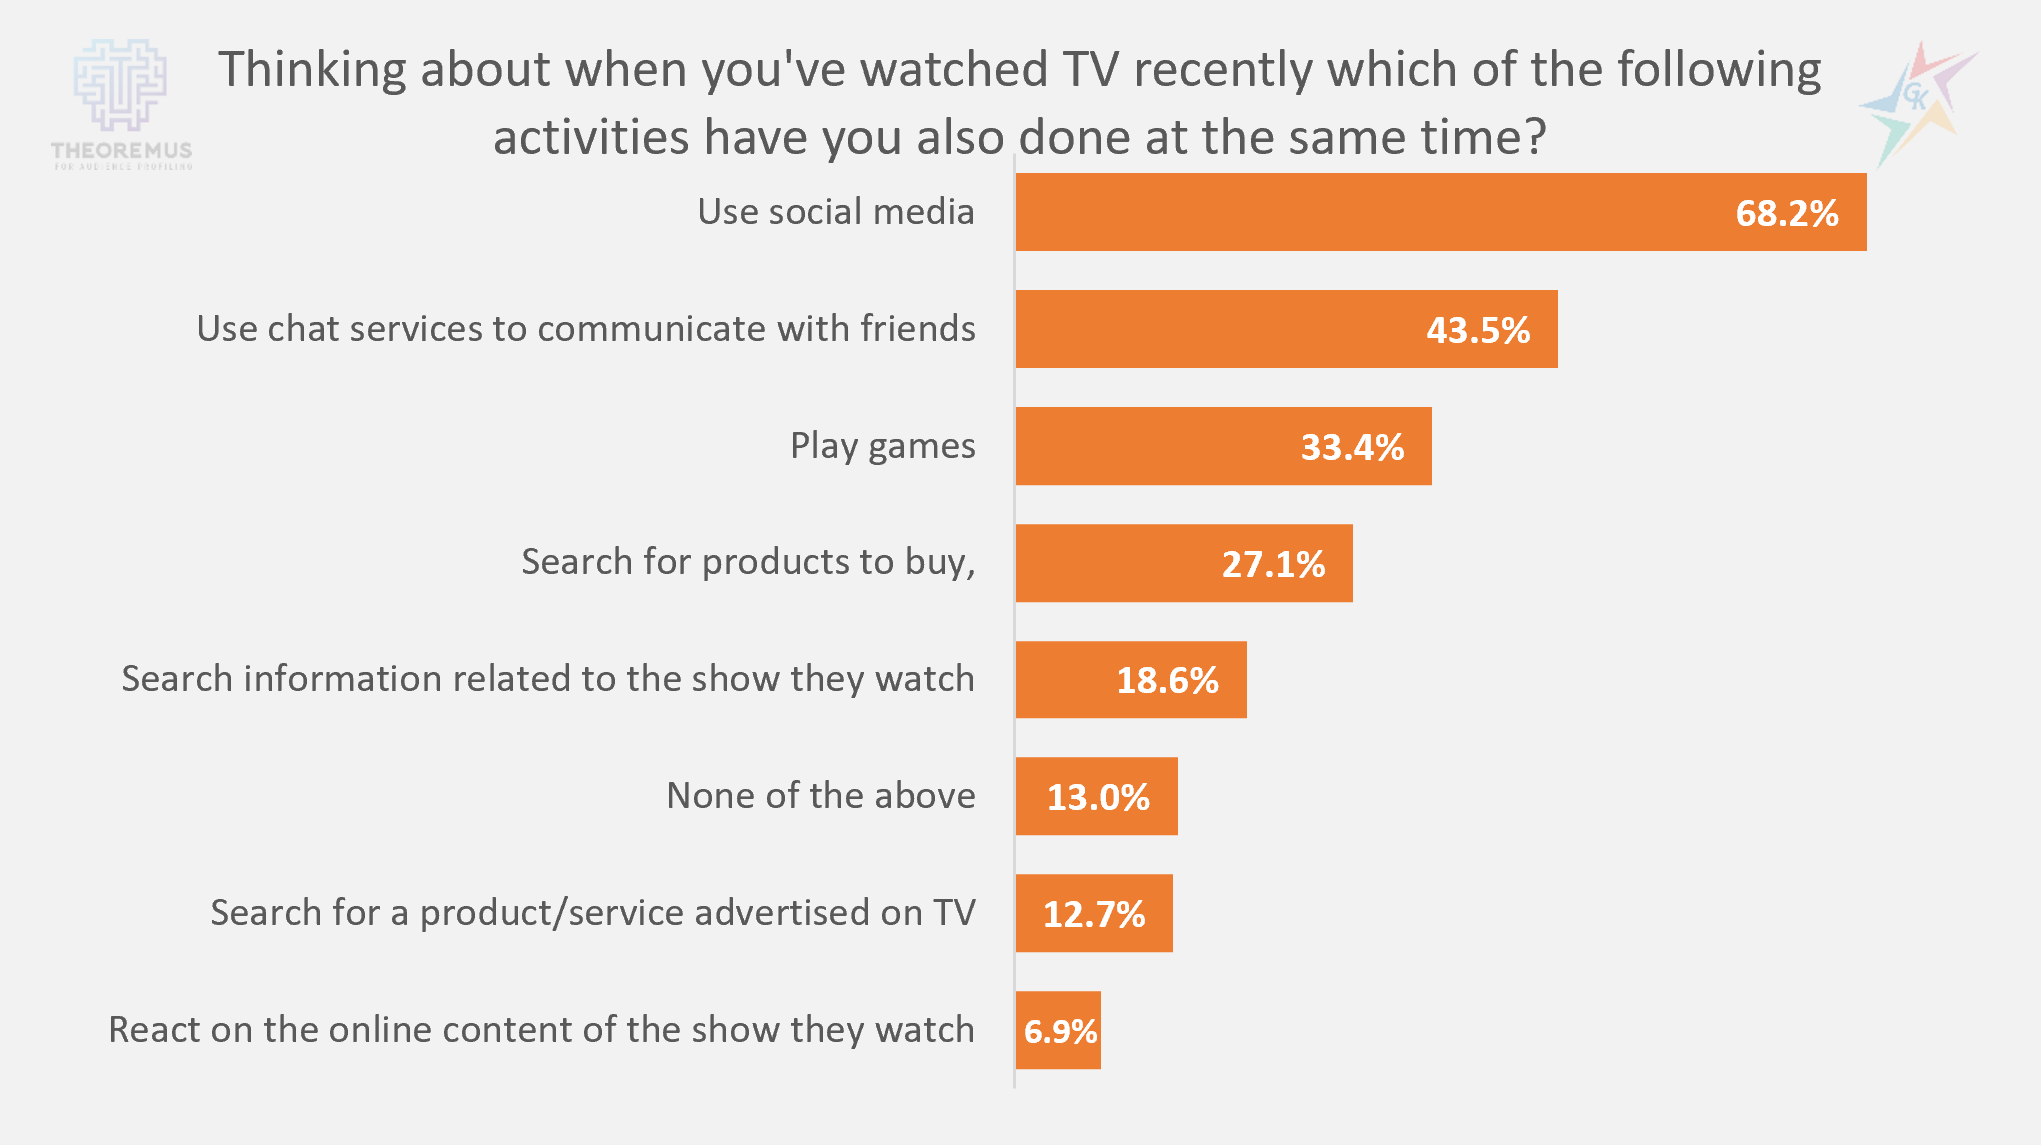
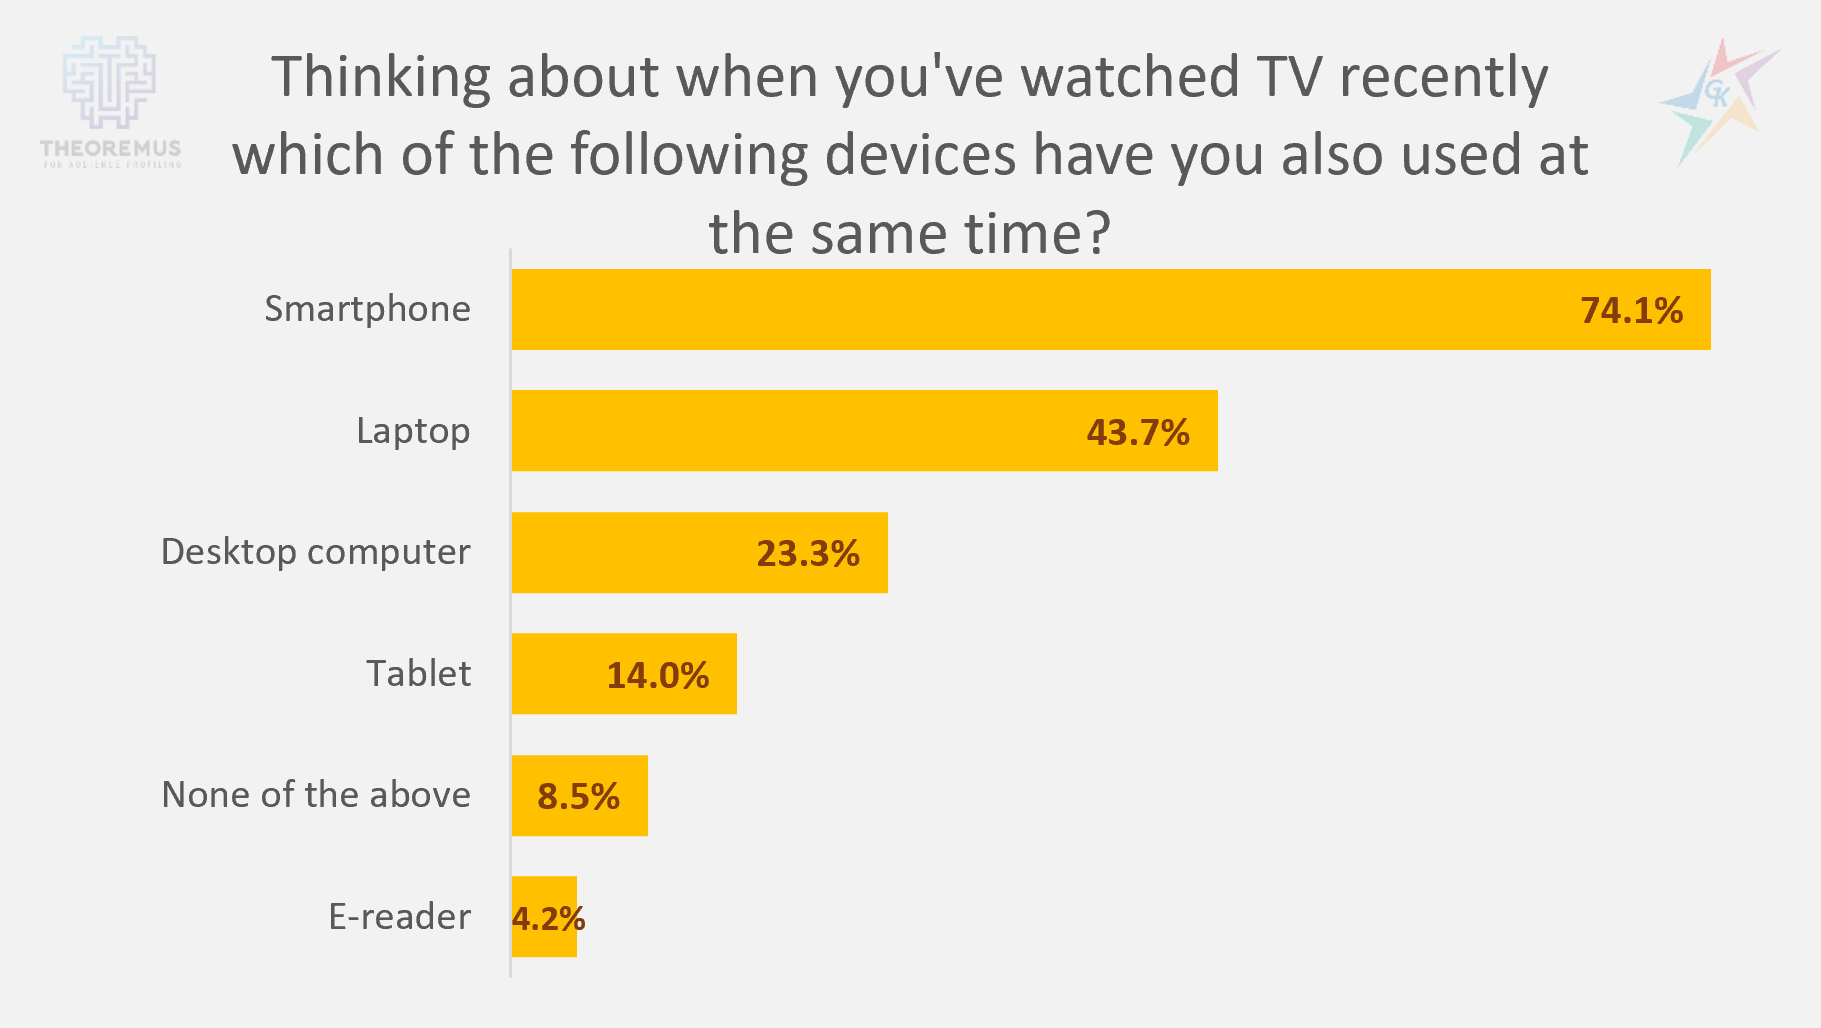
Often the viewer’s attention is distracted and the TV in the room is used as a background for other activities. To the question ” Thinking about when you’ve watched TV recently which of the following activities have you also done at the same time?” the highest percentage (68.2%) answered that they have used social media in the meantime. Other common actions that TV audiences take are chatting with friends and playing games. 18.6% of viewers were excited about the TV content and sought additional information about it, and 12.7% undertook a search for a product seen in a TV commercial.
Not surprisingly, the results are presented in the chart above, which shows the devices used while watching TV. The highest percentage – 74.1%, answered the easily accessible smartphone, and only 8.5% answered “None of the above”.
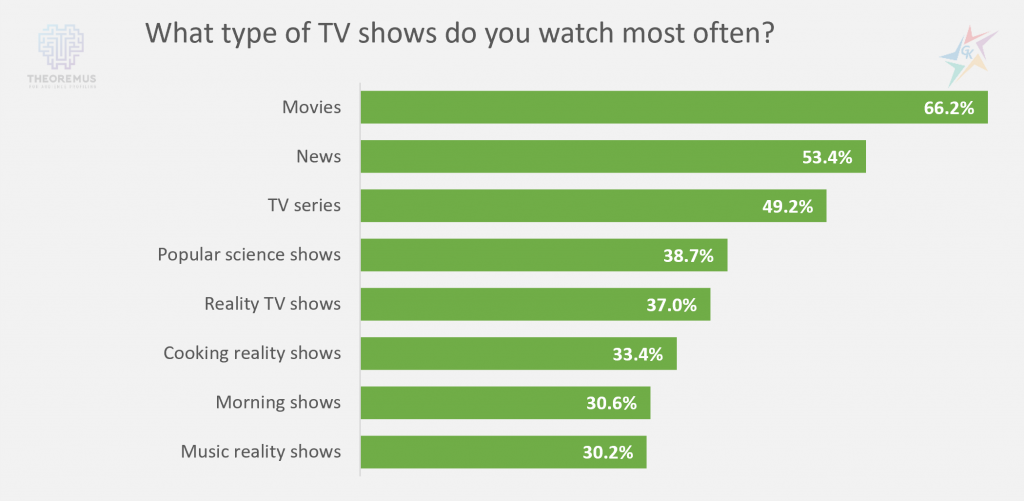
Despite the side effects taken by viewers, television remains one of the strongest media channels, providing wide coverage among the audience. To make sure that our advertising messages reach our target audience the most, it is good to know what TV content our audience is most interested in:
The most popular are movies (66.2%), followed by news (53.4%) and TV series (49.2%). In the background are the various types of reality formats, which are an integral part of the program of leading television.
This summer we expect several sporting events, which traditionally enjoy great spectator interest. 24.5% of the respondents answered that they are interested in and actively follow the European Football Championship, and 22.3% are the fans of the Summer Olympic Games.
The lack of an official source of data for other media channels often leads to their underestimation and less frequent use in the media mix. To get an idea of the audience’s attitudes towards them, we present the following charts based on data from Theoremus:
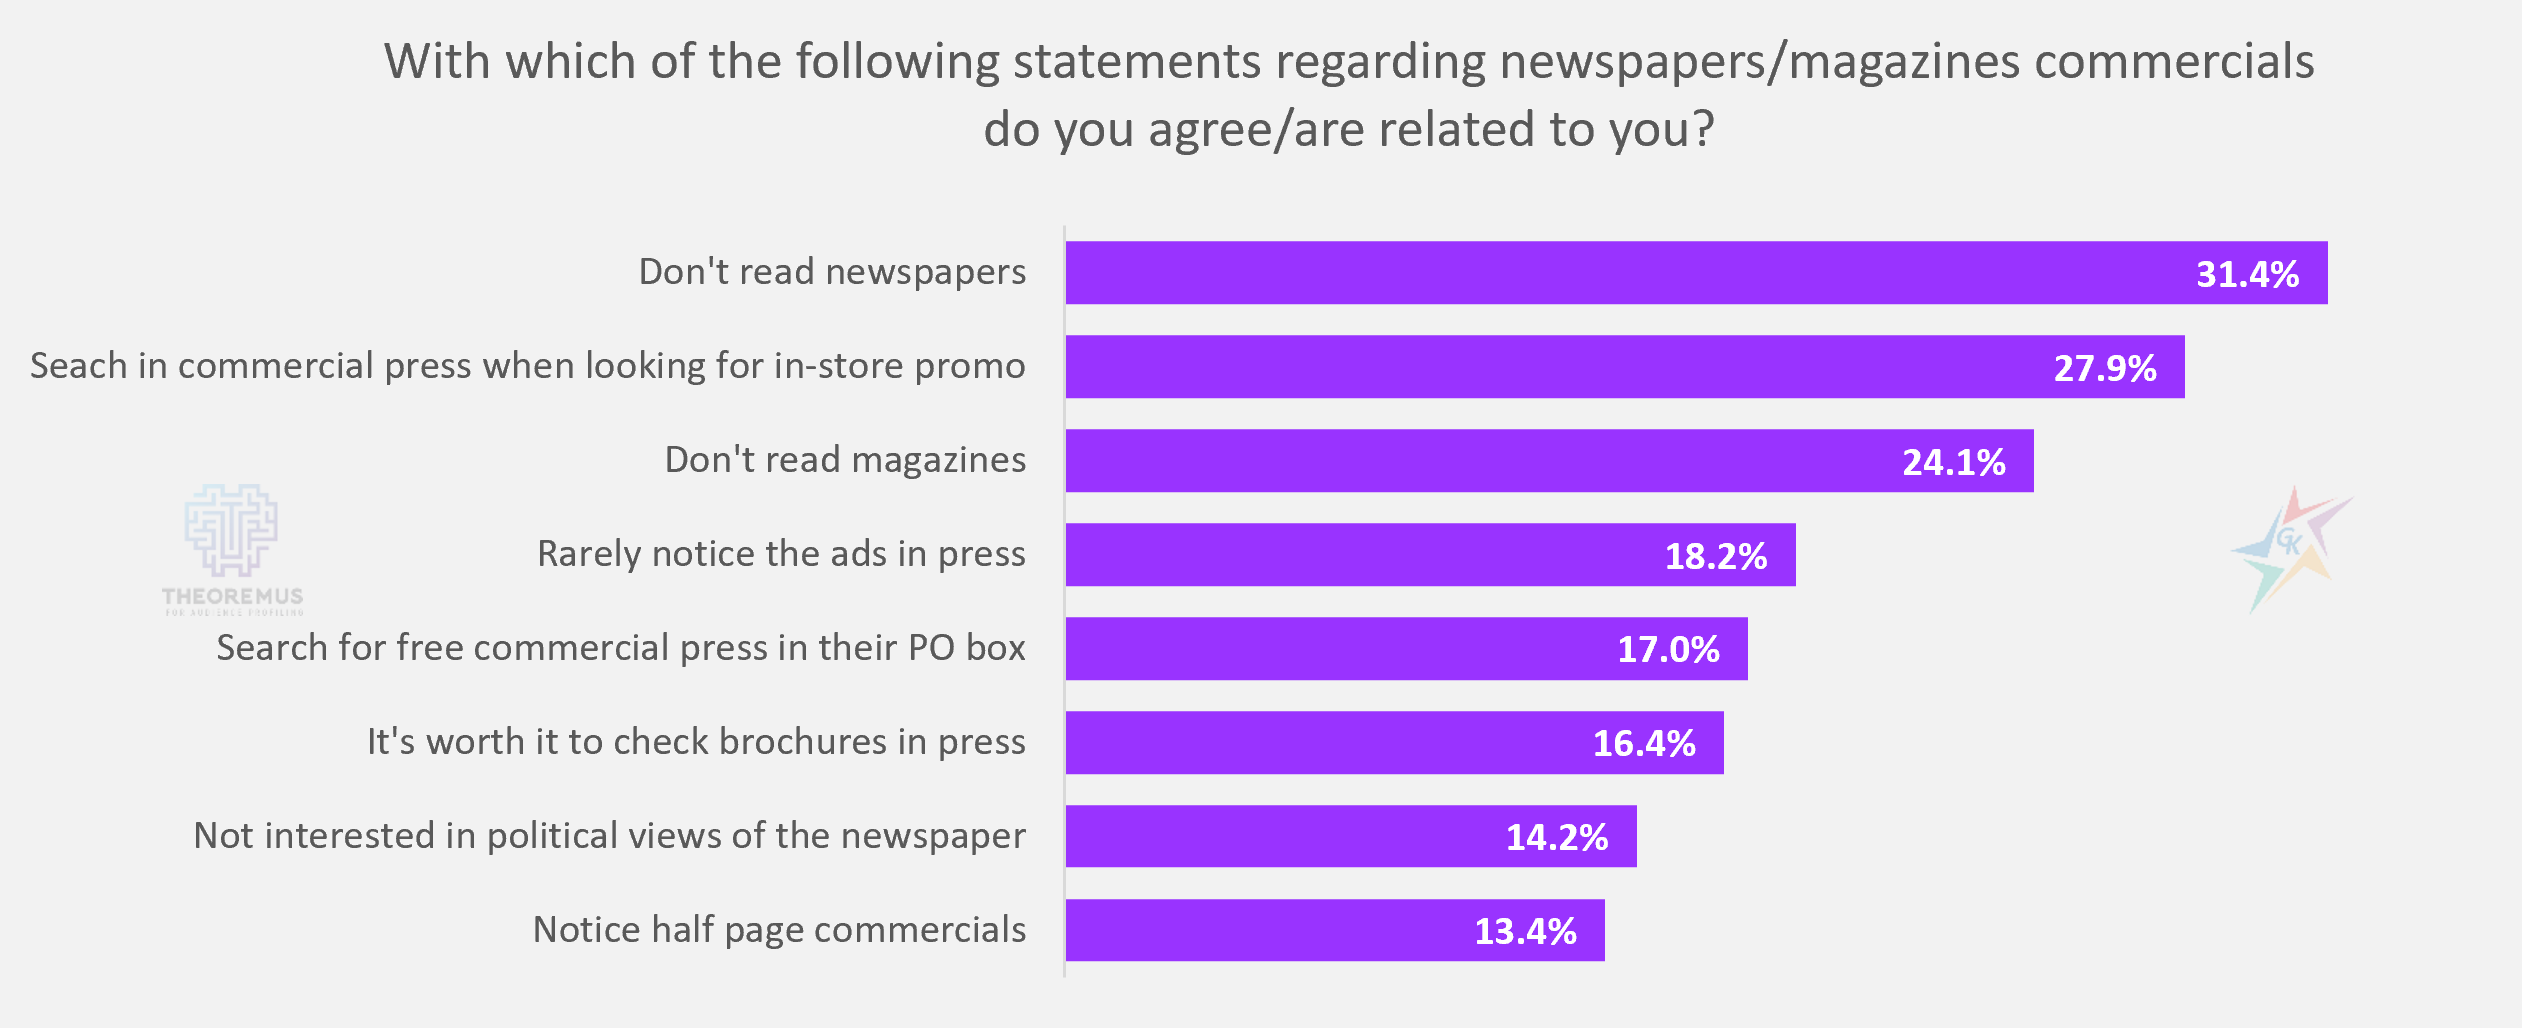
The chart presents ranking of the statements regarding PRINT media, with which the readers are most recognized. 31.4% of the respondents answered that they do not read newspapers (printed), and 24.1% – magazines (printed). A relatively close percentage of the audience agree with the statements that they are looking for free commercial brochures in their PO boxes (17%) and that it is worth checking brochures in the press (16.4%).
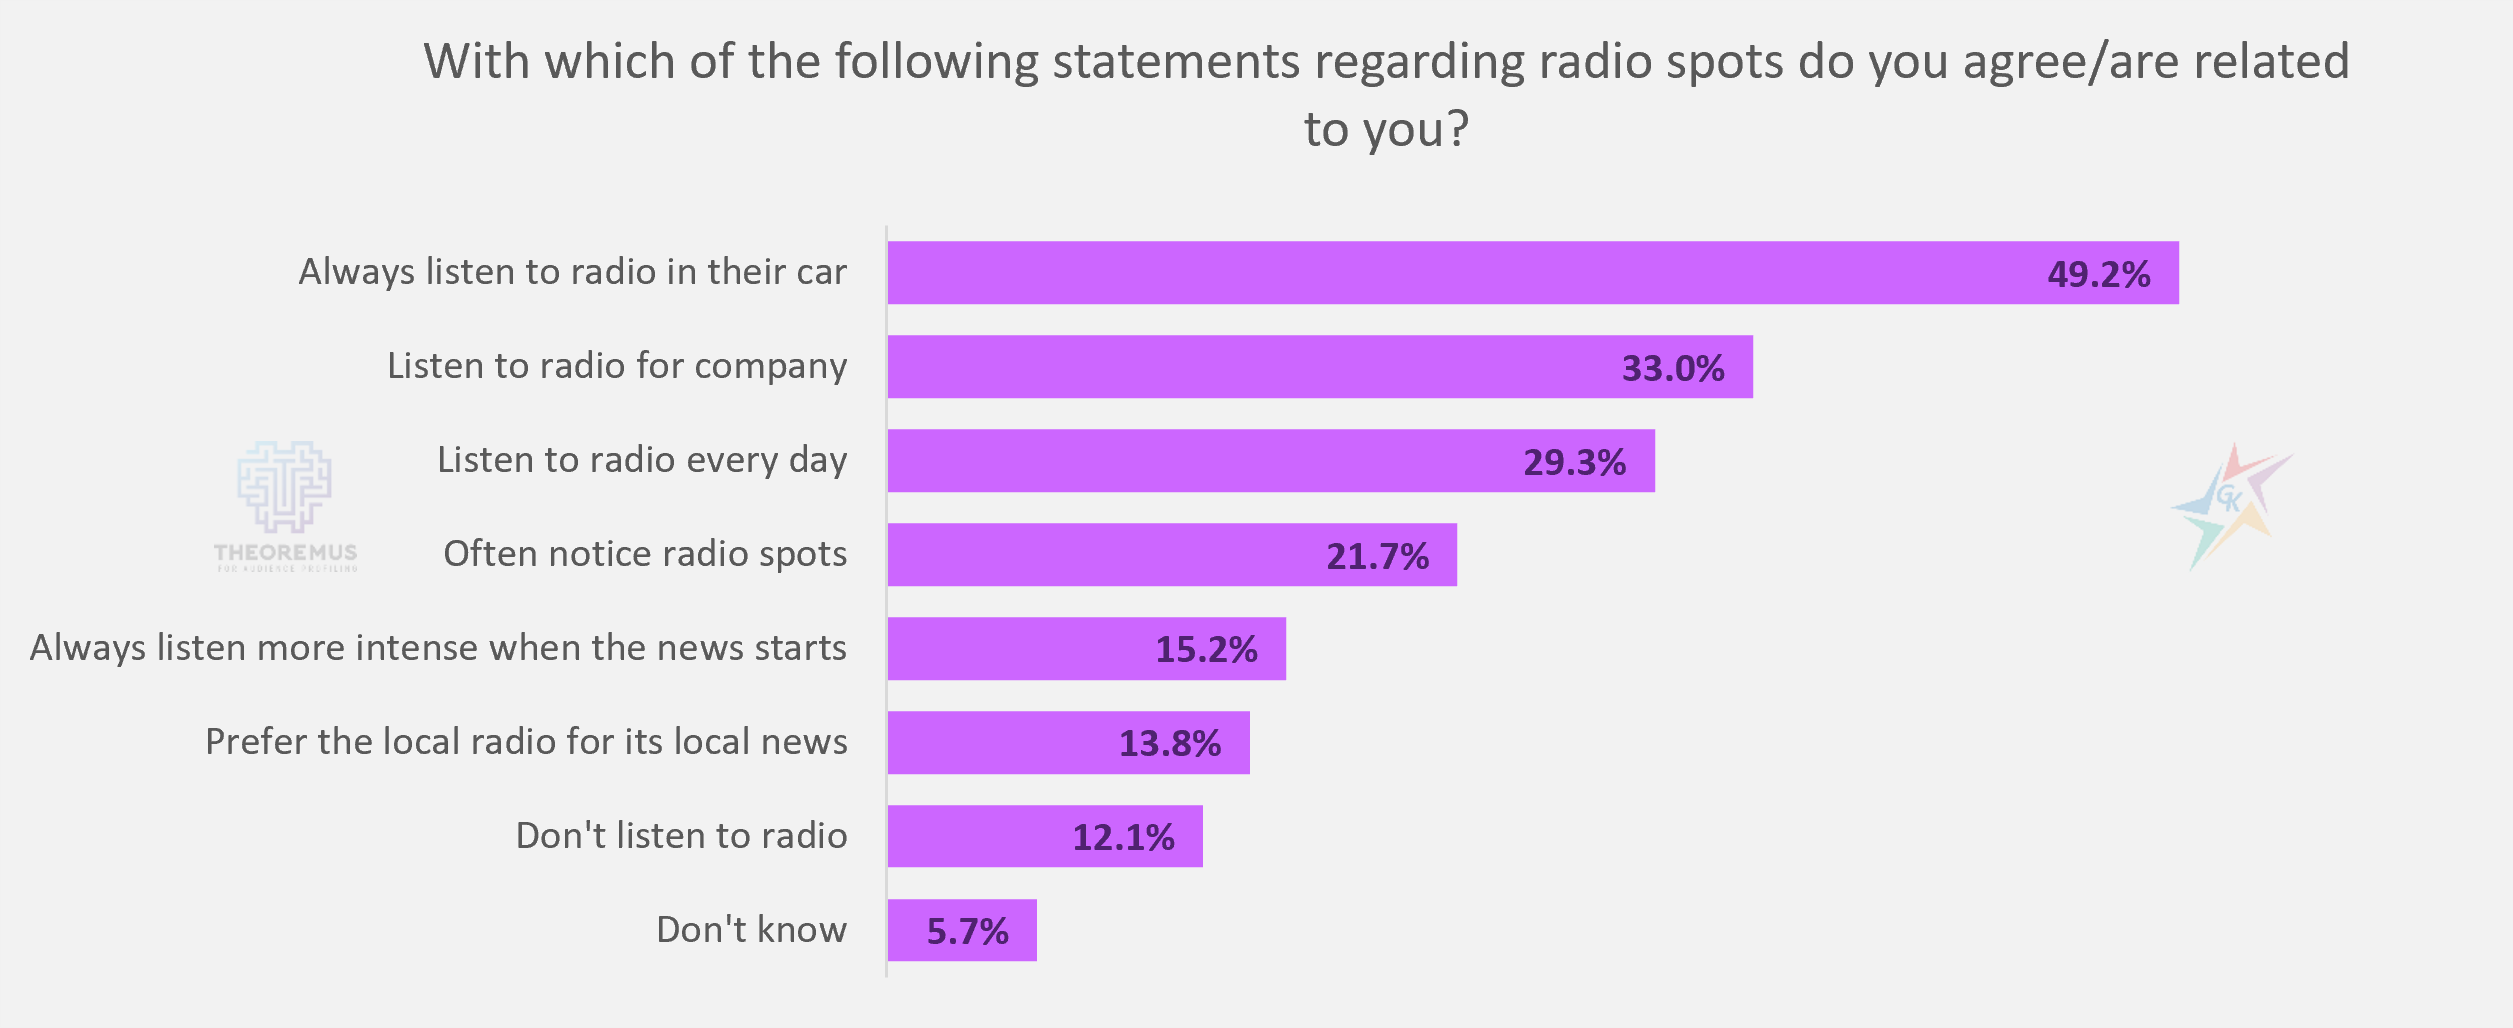
The chart shows that radio fans mostly agree with the statement that when they are in the car they always listen to the radio (49.2%). Almost 30% of respondents listen to the radio every day, and 21.7% are often notice spots on the radio. In addition to background music and good mood, radio often is a source of up-to-date news content. 15.2% of people sharpen their attention when a news program on the radio begins.
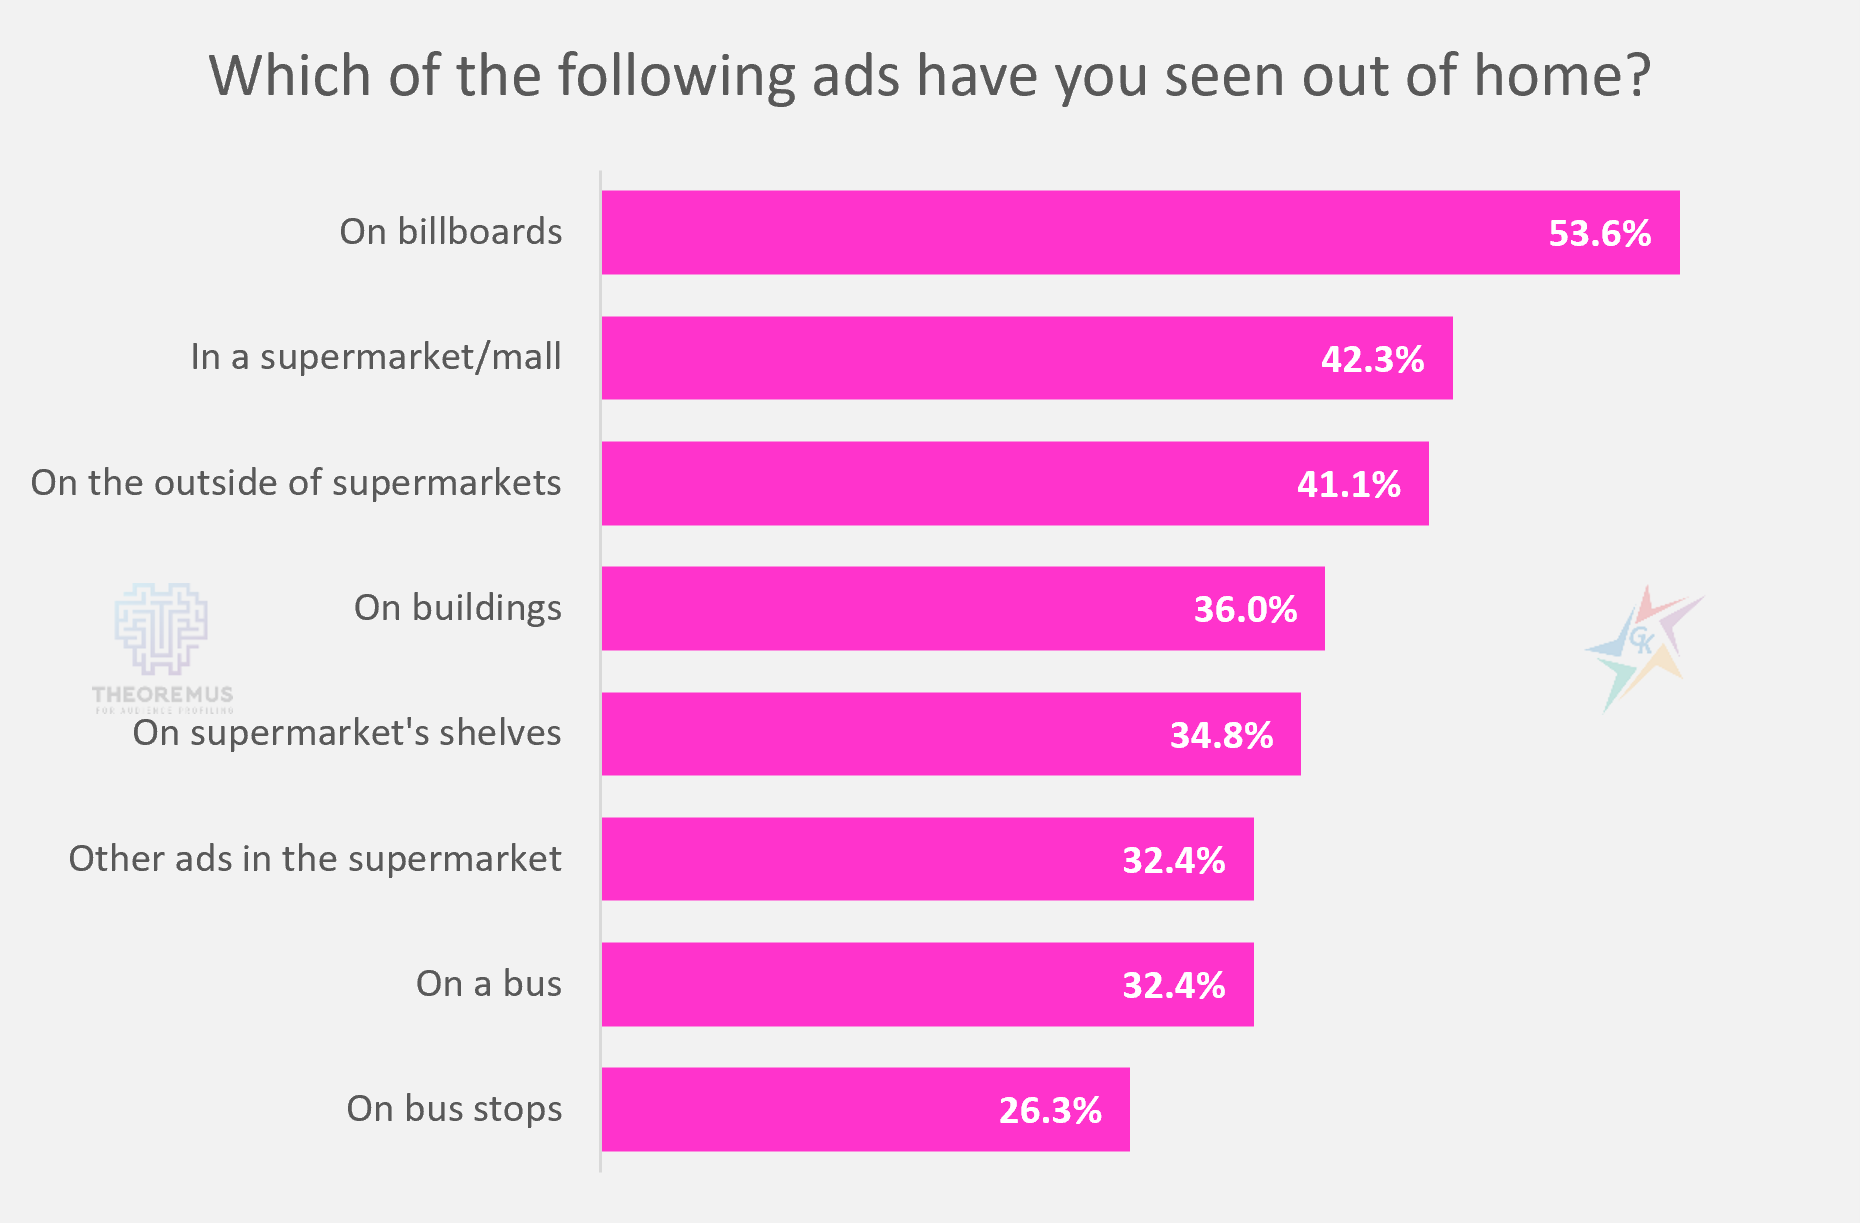
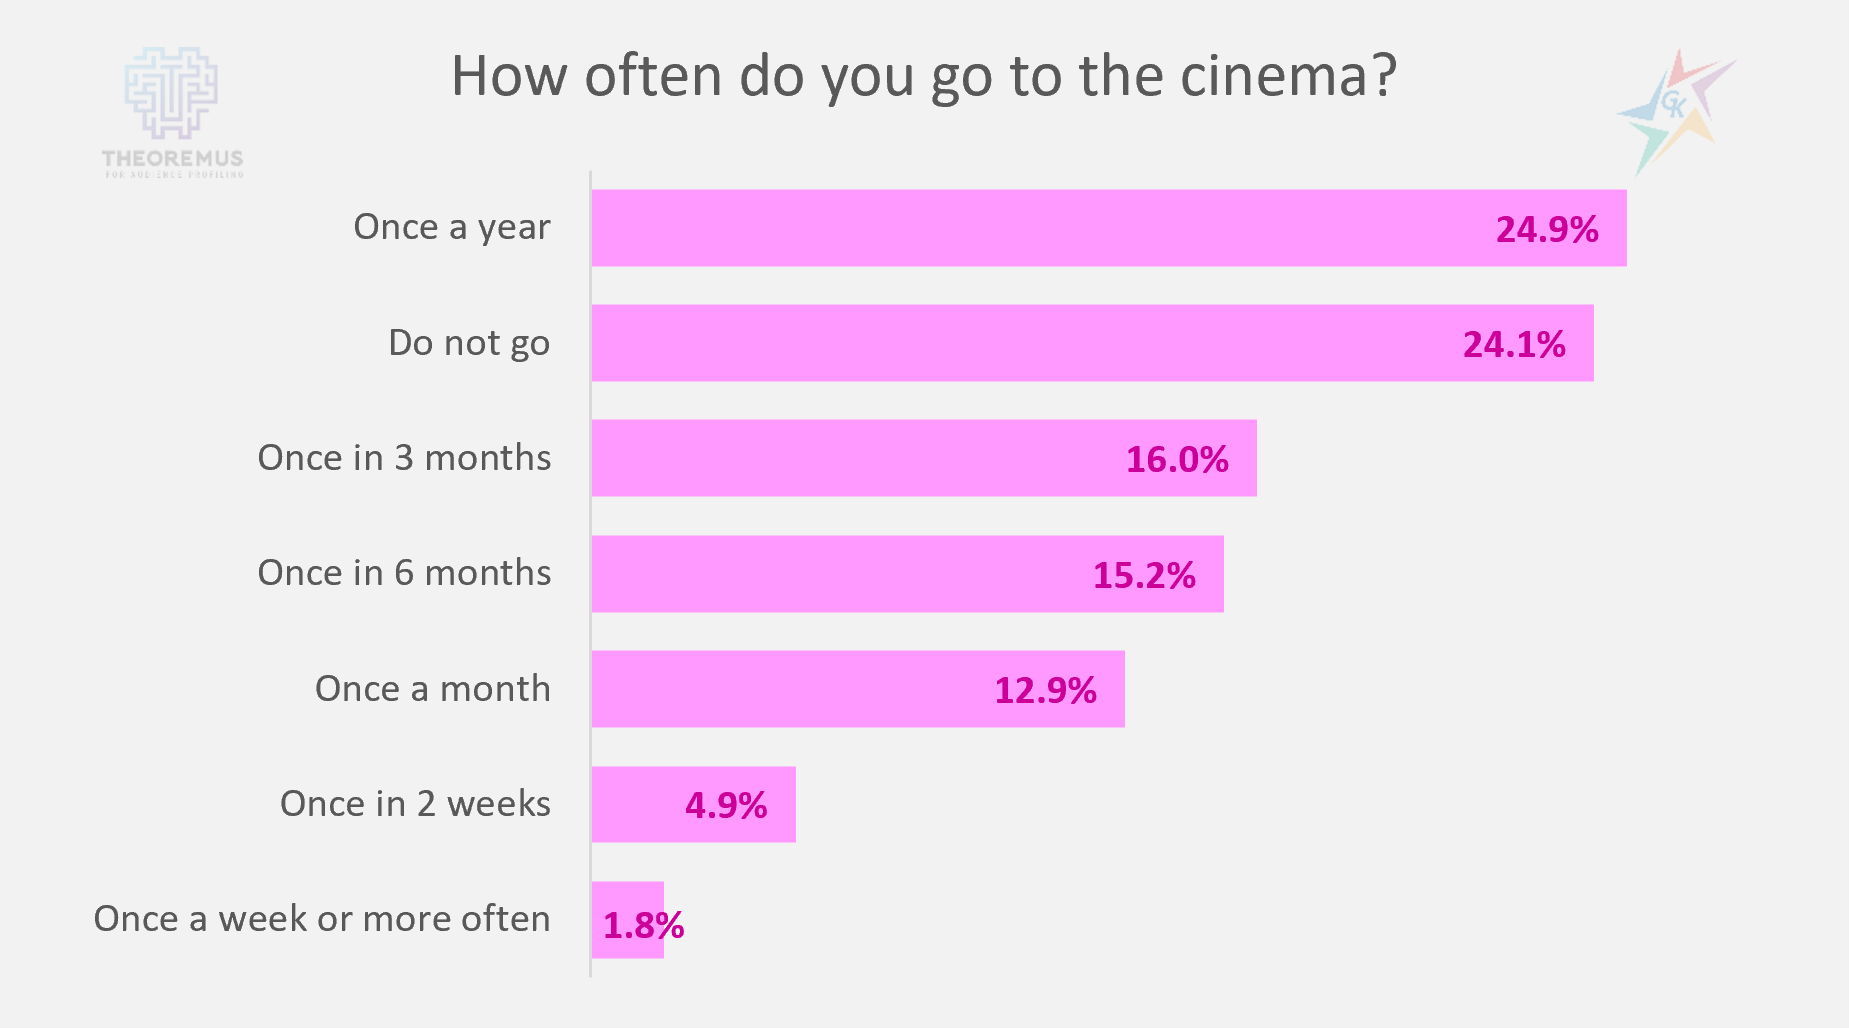
In addition to the media channels already described, the Theoremus platform also studies the audience’s attitudes towards outdoor advertising and cinema.
The most noticeable advertising medium out of home is the billboard, 53.6%. Consumers’ attention is often focused on the various media in the supermarket – inside in stores (42.3%), outside stores (41.1%), as well as on the shelves themselves (34.8%). In addition to researching attractive offers for potential purchases, in the last year supermarkets have been constantly open to visitors, unlike large shopping malls, restaurants and cinemas. This is one of the reasons why the largest percentage of people (24.9%) visit cinemas once a year. In April 2021, when the survey was conducted, the percentage of people who do not go to the movies at all continued to remain high – 24.1%.
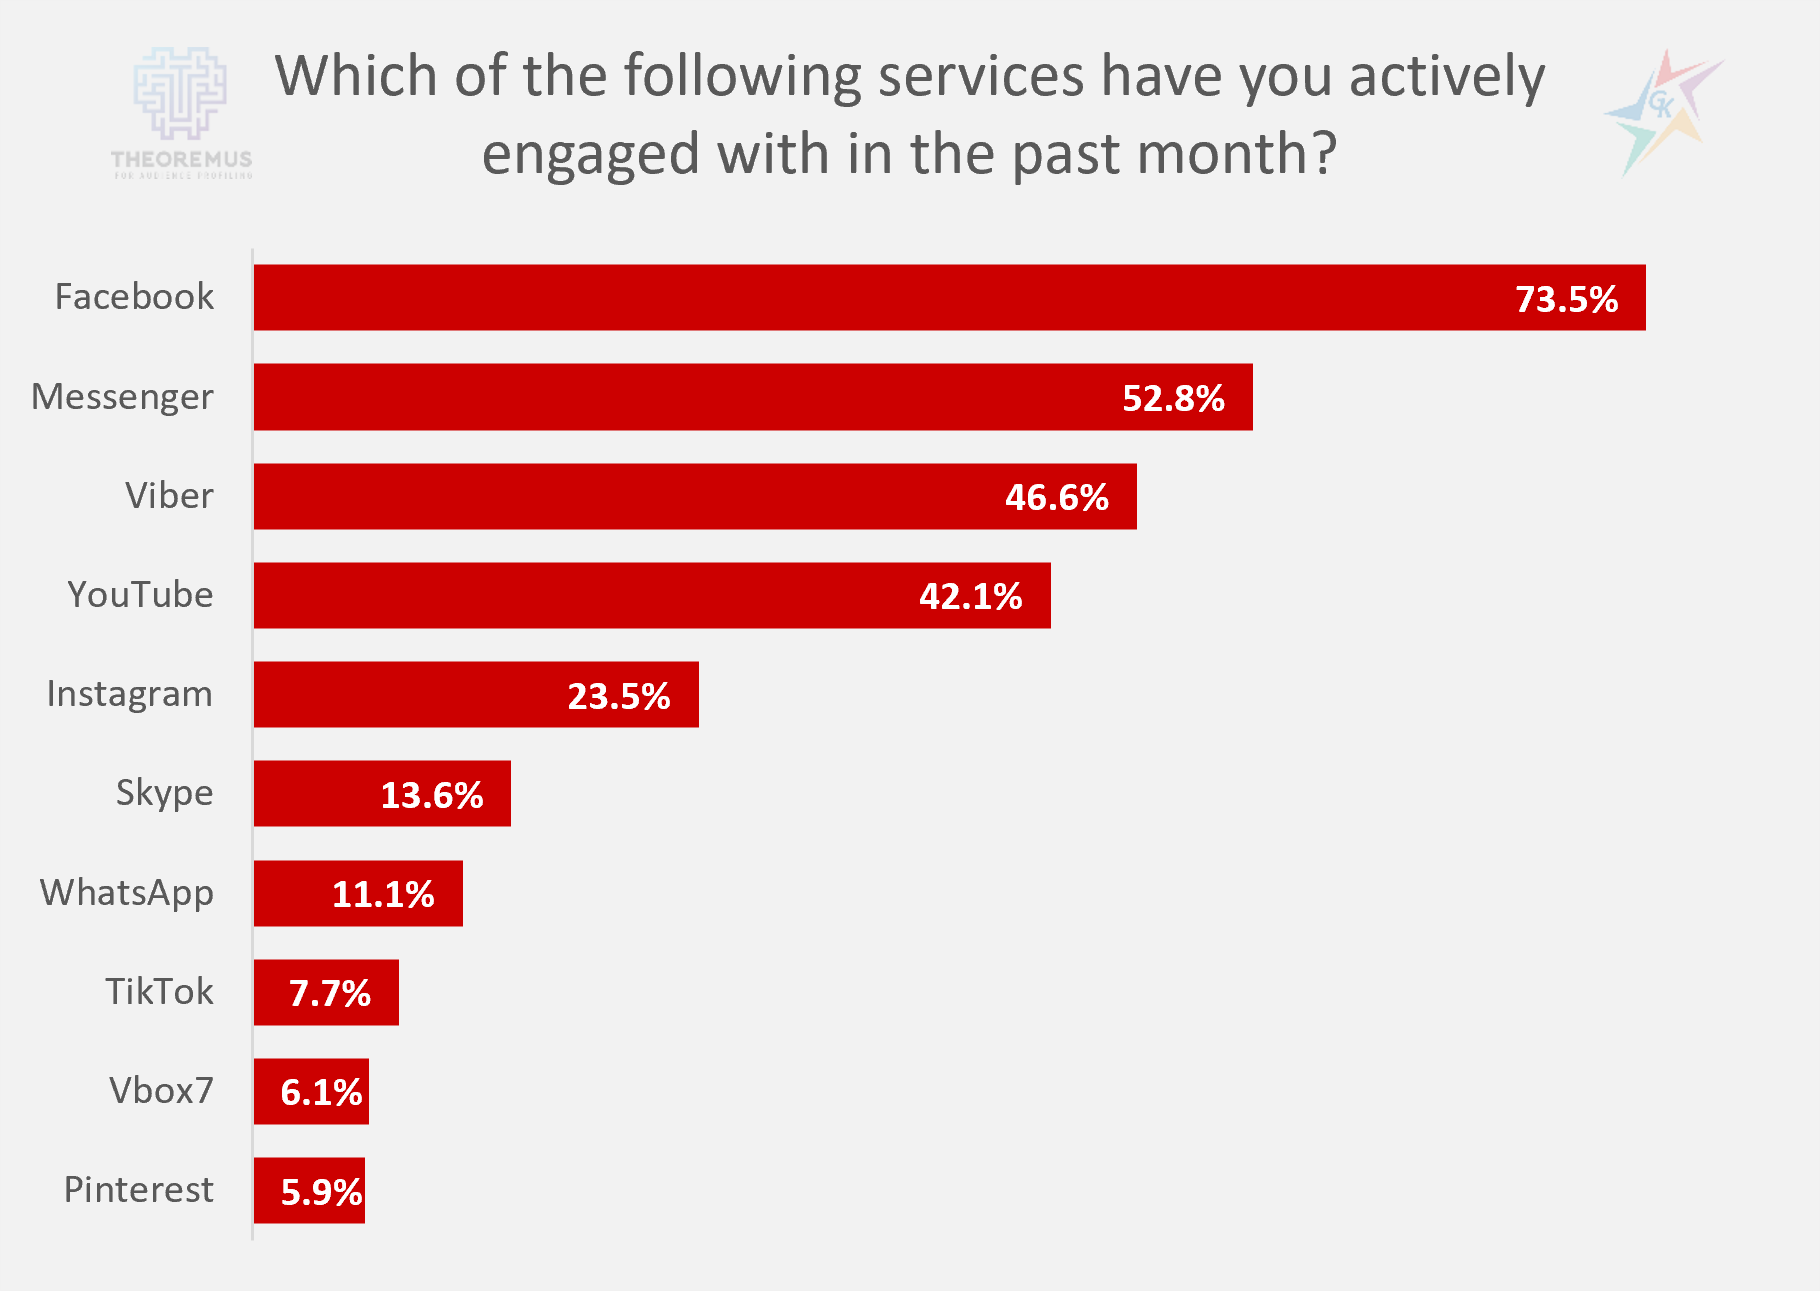
The charts and data presented are just some of the answers we can get from Theoremus. In addition to traditional media channels, the focus is also on internet consumption and social media. Due to the popularity of these media channels, we present the answers to the questions we ask ourselves most often:
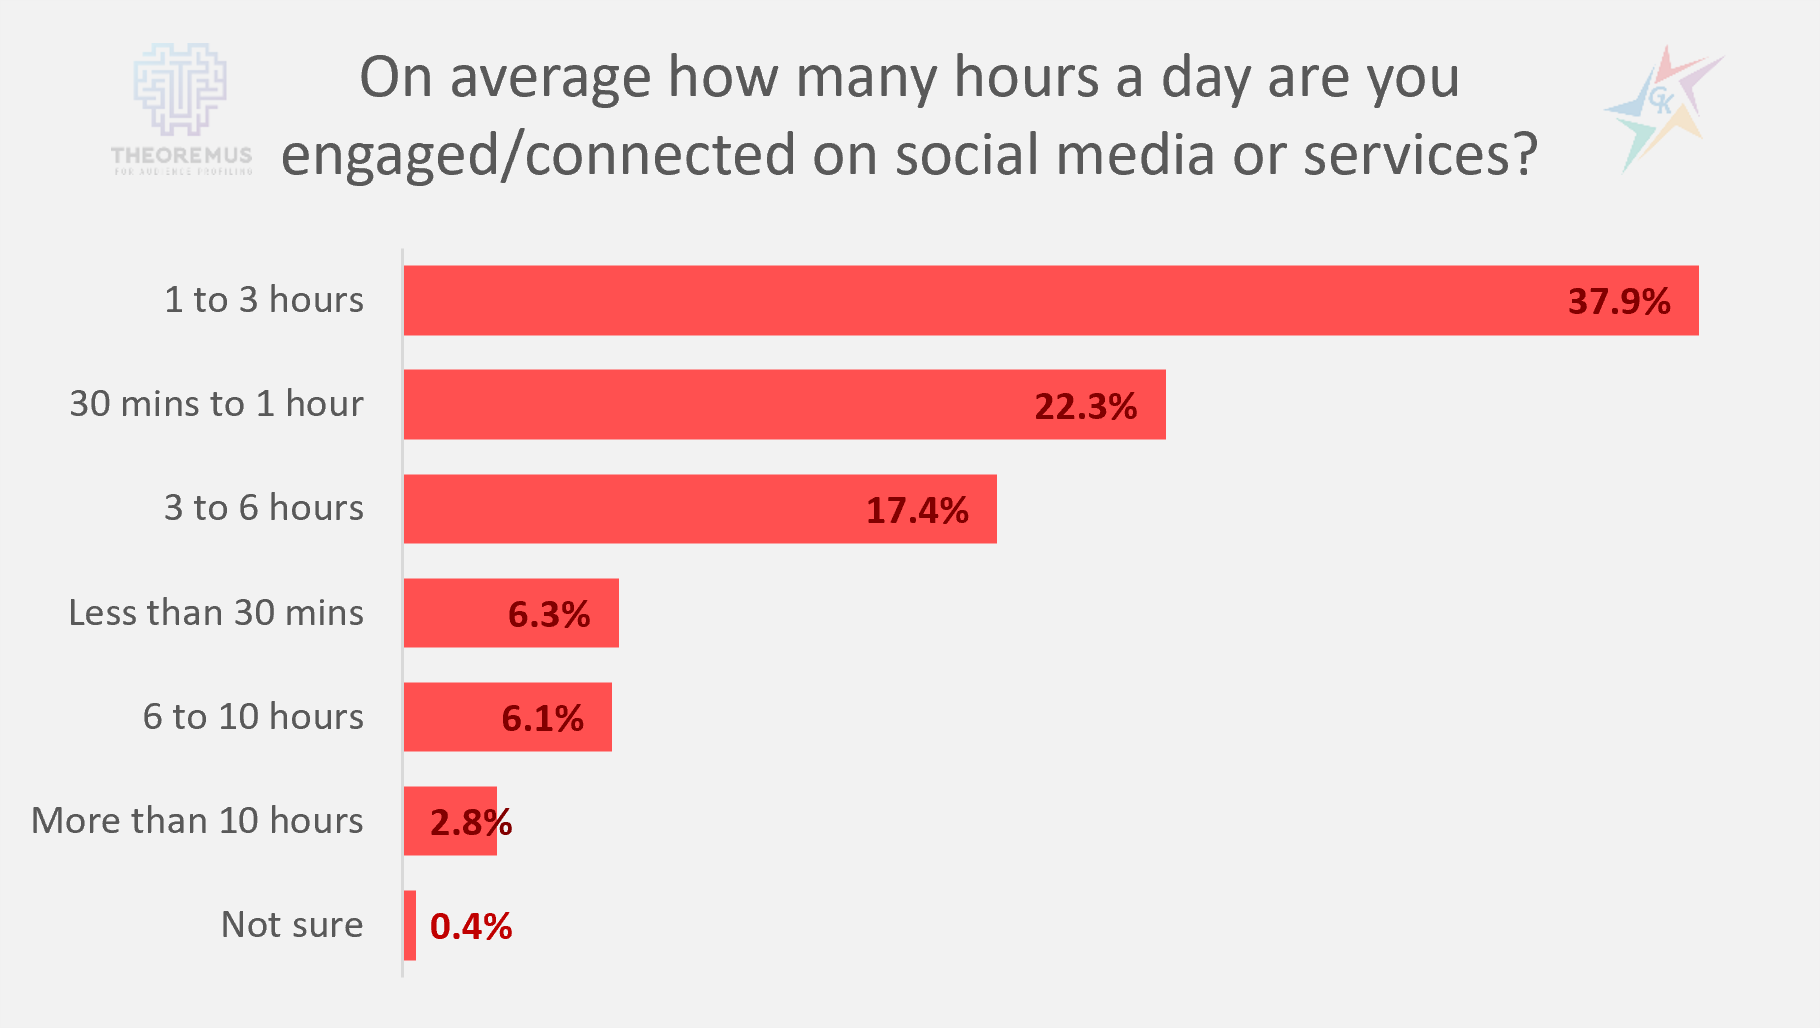
73.5% of the audience say that they are active users of Facebook, and 52.8% are users of the specially developed chat system to it – Messenger. Their main competitor Instagram ranks fifth with 23.5%, which confirms the opinion that the platform is less popular in our country for the broad target group for which the data are representative. Most people spend on average between 1 and 3 hours a day on social media, and the share of people who spend between 3 and 6 hours a day is not small – 17.4%.
Our team remains at your disposal to provide additional information about Theoremus, as well as to prepare specific analyzes upon your request. For additional information, please contact our team via the contact form.
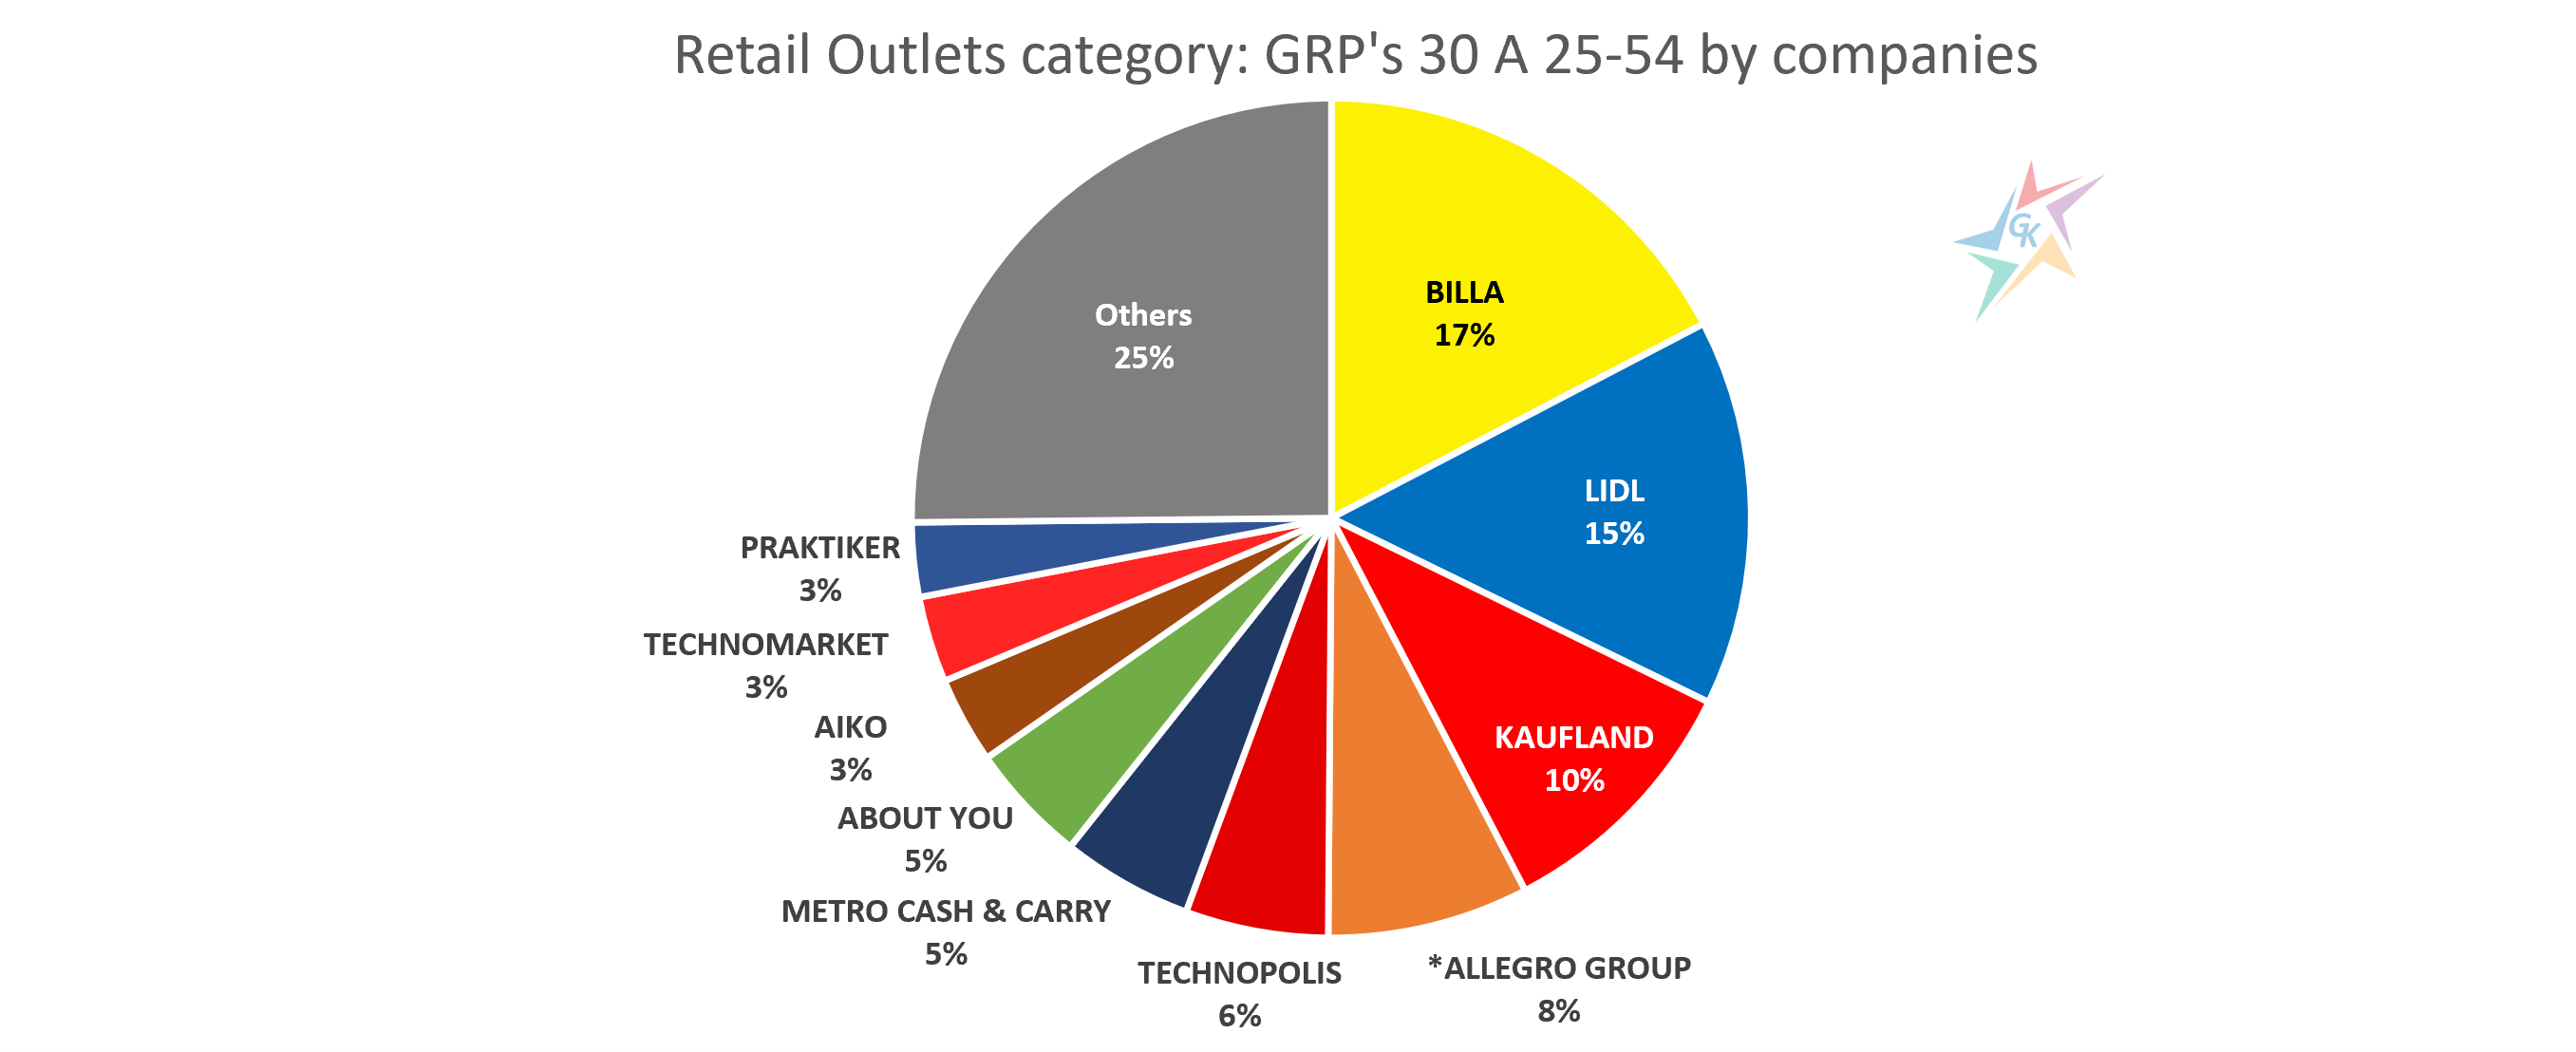
In the last year we have witnessed a rapid transformation of the business into a new reality. Much of it responds to emerging customer needs by moving to an online environment and expanding its portfolio of goods and services. These changes did not go unnoticed by the participants in the category “Retail outlets”, which is one of the largest and fastest growing in 2021. More and more online platforms continue to join the standard retail chains, offering everything you need at a click away from users. This trend is also being successfully adopted by the standard physical stores, many of which have made their products available for online shopping. To these two segments is added a third, whose activity is to connect physical stores with customers, delivering the desired products to the door (BG Menu, Foodpanda, Glovo). Despite the difficult division and categorization of the main activity of the participants in the sector, in the following chart we answer the question who are the biggest advertisers in the “Retail Outlets”:
The chart illustrates the top 10 advertisers in the category for the first four months of the year based on the reported weighted GRP’s 30 for target group A 25-54. To assess their development, we also added in tabular form the results for the same period for 2020:
Source: GARB Audience Measurement Bulgaria. Period: January-April, 2020 and 2021.
This year, the leading positions are reserved for the established retail chains of stores BILLA, LIDL and KAUFLAND. Serious growth was recorded by BILLA, 40% above the GRP’s 30 in January-April 2020, which took it to the first position in the ranking for 2021. LIDL lost the lead, registering 3% decrease compared to the same period in 2020. KAUFLAND’s communication on television also declined, but the company still maintained its position. METRO CASH & CARRY is the latest FMCG chain to participate in the ranking of the largest advertisers in the sector. The company recorded 18% growth and thus managed to maintain last year’s sixth position in “Retail Outlets” category.
Fourth place in the ranking is occupied by ALLEGRO GROUP, which represents emag.bg, fashiondays.bg and olx.bg. Here it is important to note that since February this year, the official TV monitoring system – GARB, transferred their activities from the category “Telecommunications” to “Retail outlets” and in the table they participate with their results for the period February-April 2021. In order to provide an objective information regarding their performance, below the table is described the data from the communication of the company as a whole for both considered periods. From these figures it is clear that in the first four months of the year their activity in television increased by 21% compared to the same period in 2020. Another representative of online commerce in the ranking is ABOUT YOU. The company is a new advertiser, launched its television activity in the fall of 2020 and is focused on online marketing of famous fashion brands. It quickly took a share, reaching seventh place in the rankings. The companies in question are far from the only representatives of the online commerce that are on TV. The list of active advertisers also includes EOBUWIE.PL (obuvki.bg and modivo.bg), VIVRE DECO, ANSWEAR.COM, BG MENU (takeaway.bg), FOODPANDA and many others.
There is a shift in the arrangement of the advertisers of household appliances. TECHNOPOLIS increased its GRP’s 30 by 9%, but still fell by a position down from January-April 2020. TECHNOMARKET is the other store specializing in the sale of appliances, which is present in the top 10, but recorded a 32% decline and accordingly occupies the ninth place, which is four positions down. In the first four months of the year, both ZORA and MAGNUM-D (TECHMART) have activities, but their performance ranks them below the top ten.
More and more often we are used to seeing on TV furniture stores that promote their goods with attractive offers and prices. For the period January-April 2021, the only representative who enters the top 10 is AIKO, with a 2% increase in GRP’s 30 and a position down from 2020. It is interesting to note that their communication is divided between the brands AIKO and MOMAX. Other representatives of the category that do not fall in the rankings, but also have a presence on TV are VIDENOV GROUP and IKEA.
PRAKTIKER is one of the advertisers with significant growth in January-April 2021, 32%. This investment places it in the group of top advertisers in this category and gives it an advantage over competitors such as DOVERIE BRIKO (Mr. Bricolage) and HOMEMAX-X.
The top ten companies form almost 75% of the total results in the category. All after the tenth position, a total of sixty active advertisers, generate the remaining 25%. This year, the growth of the group “Others” is almost double and one of the reasons behind is the increase in the number of active participants in the category.
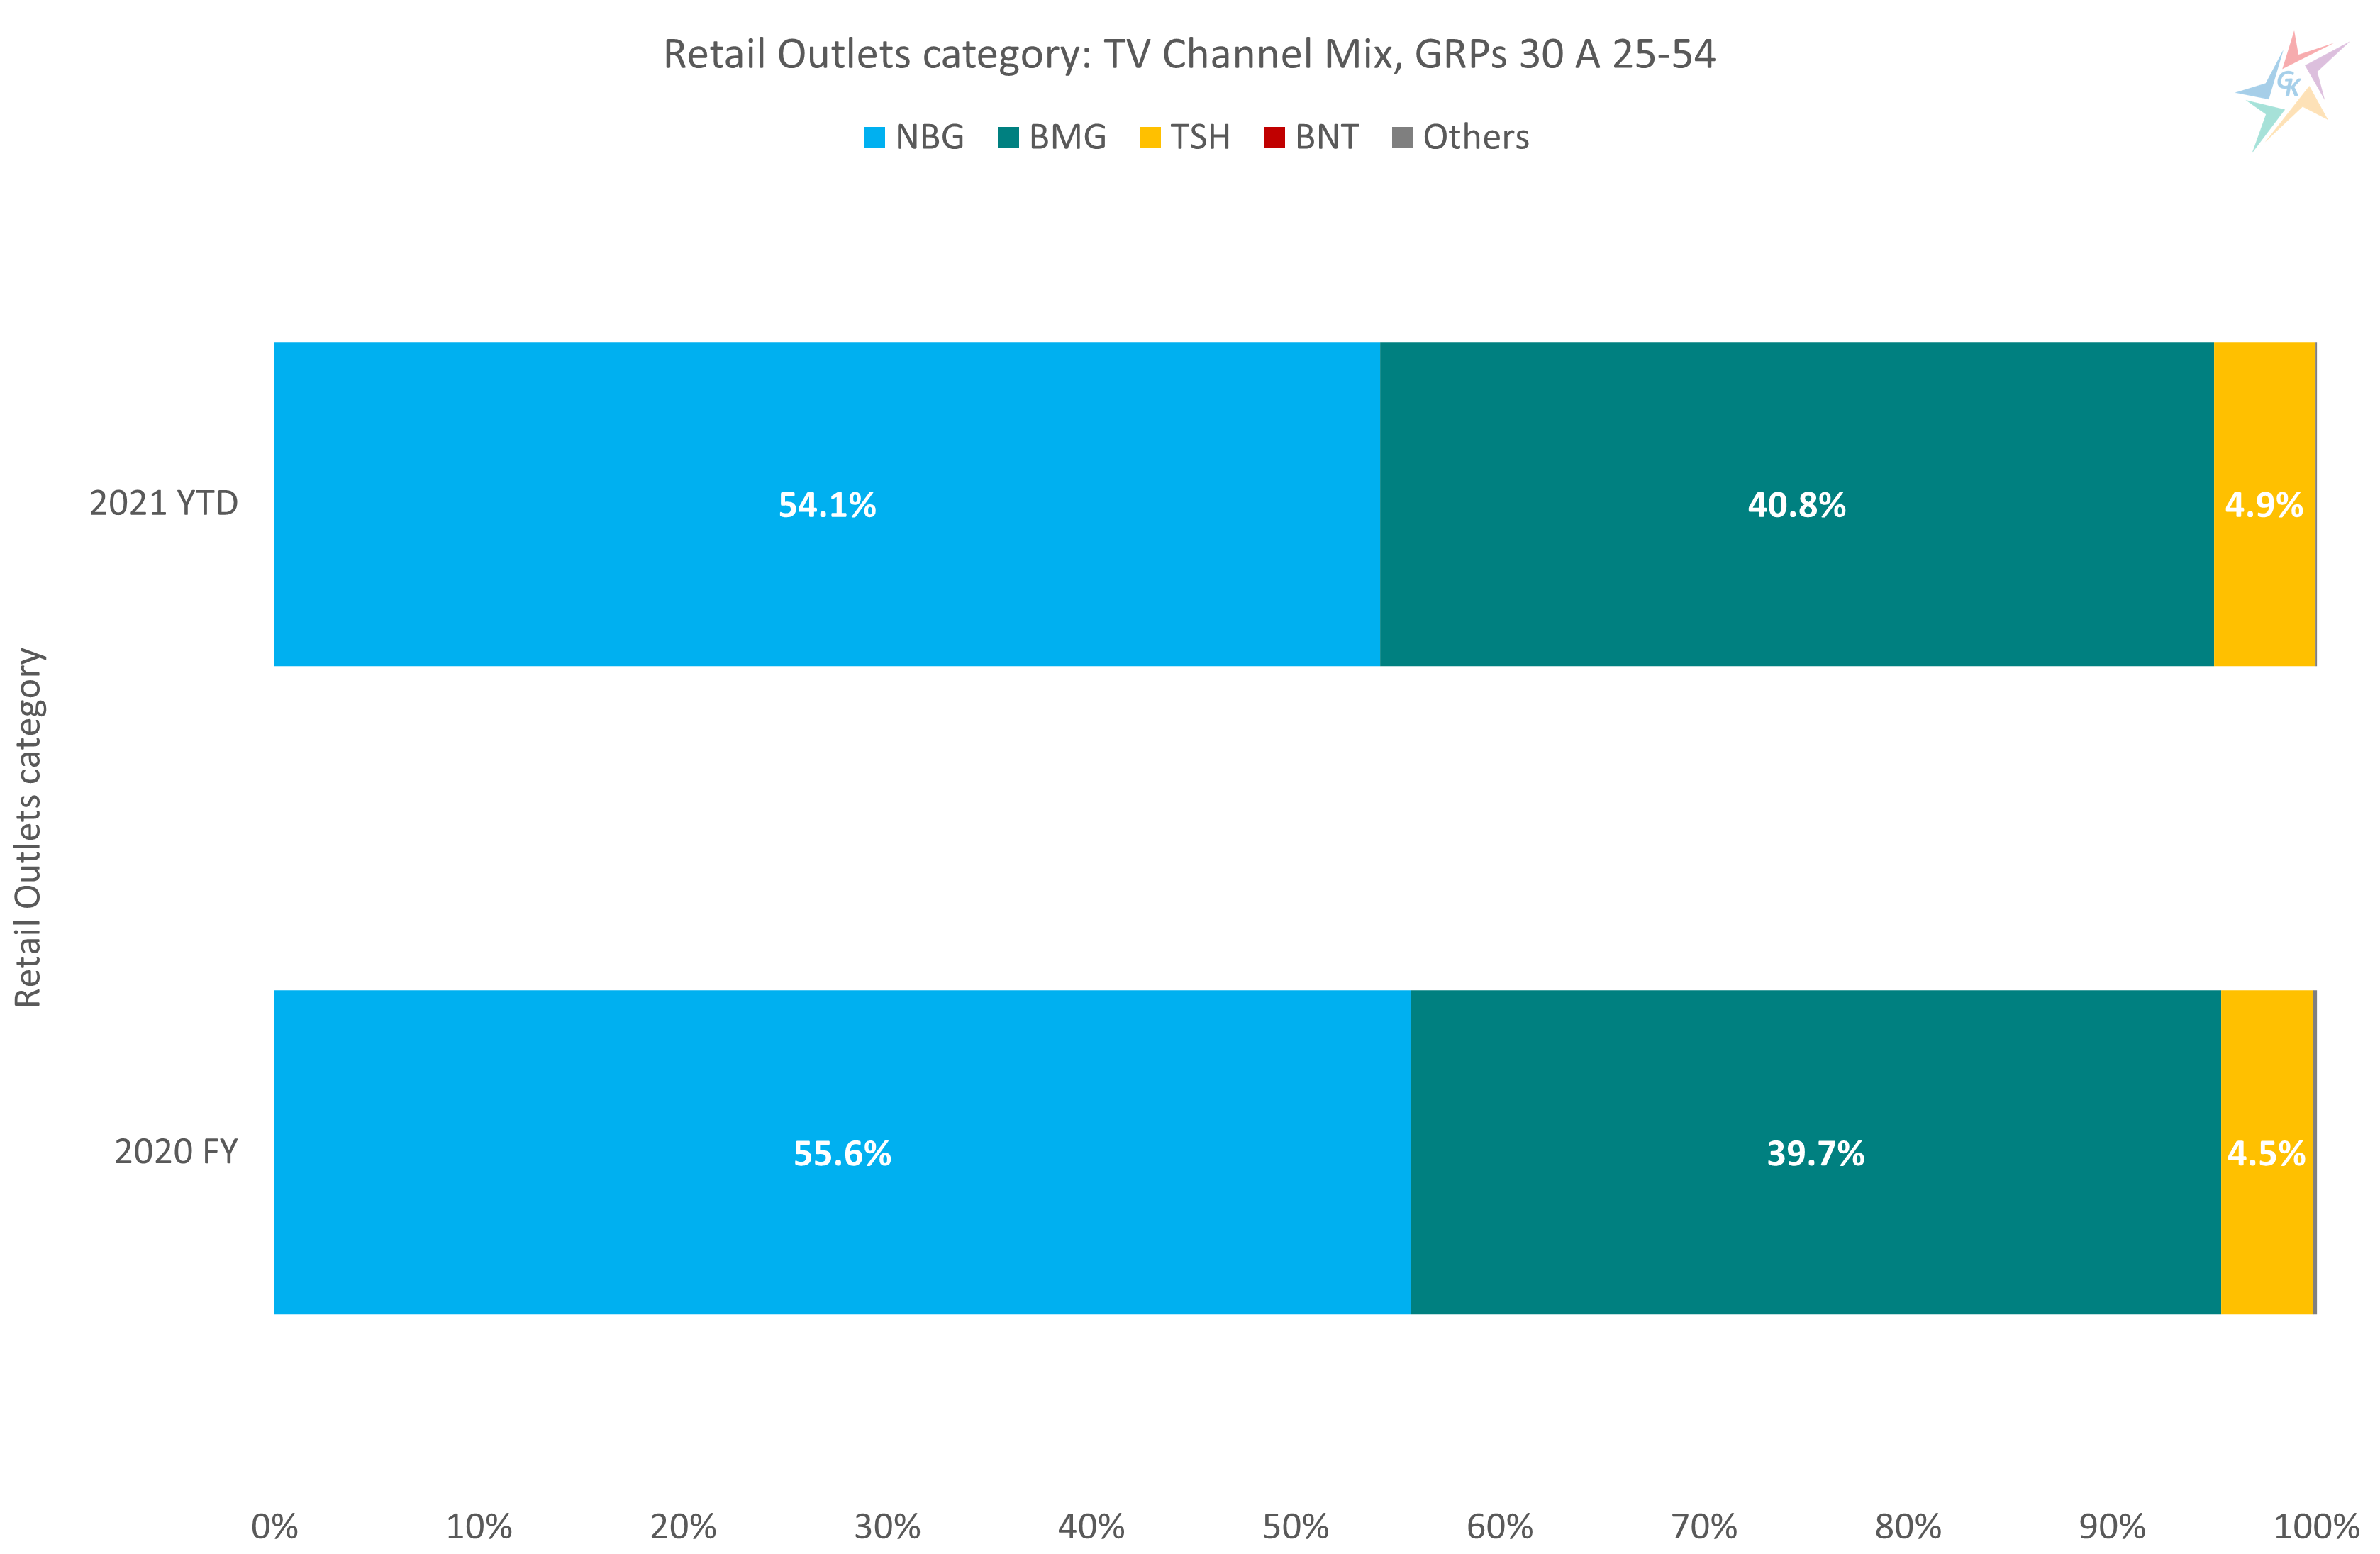
Regarding the mix of TV channels used for communication, we can summarize that there is no noticeable change:
Source: GARB Audience Measurement Bulgaria. Period: January 2020-April 2021
About 55% of total GRP’s 30 in the category are achieved by the TV channels of Nova Broadcasting Group (NBG), followed by a 40% share of the TV channels of bTV Media Group (BMG) and a 5% share of the TV channels represented by Sales House (TSH). The share of TV channels from the state owned BNT, as well as TV channels that are not part of a large group is below 0.2%.
For additional information, please contact our team via the contact form.
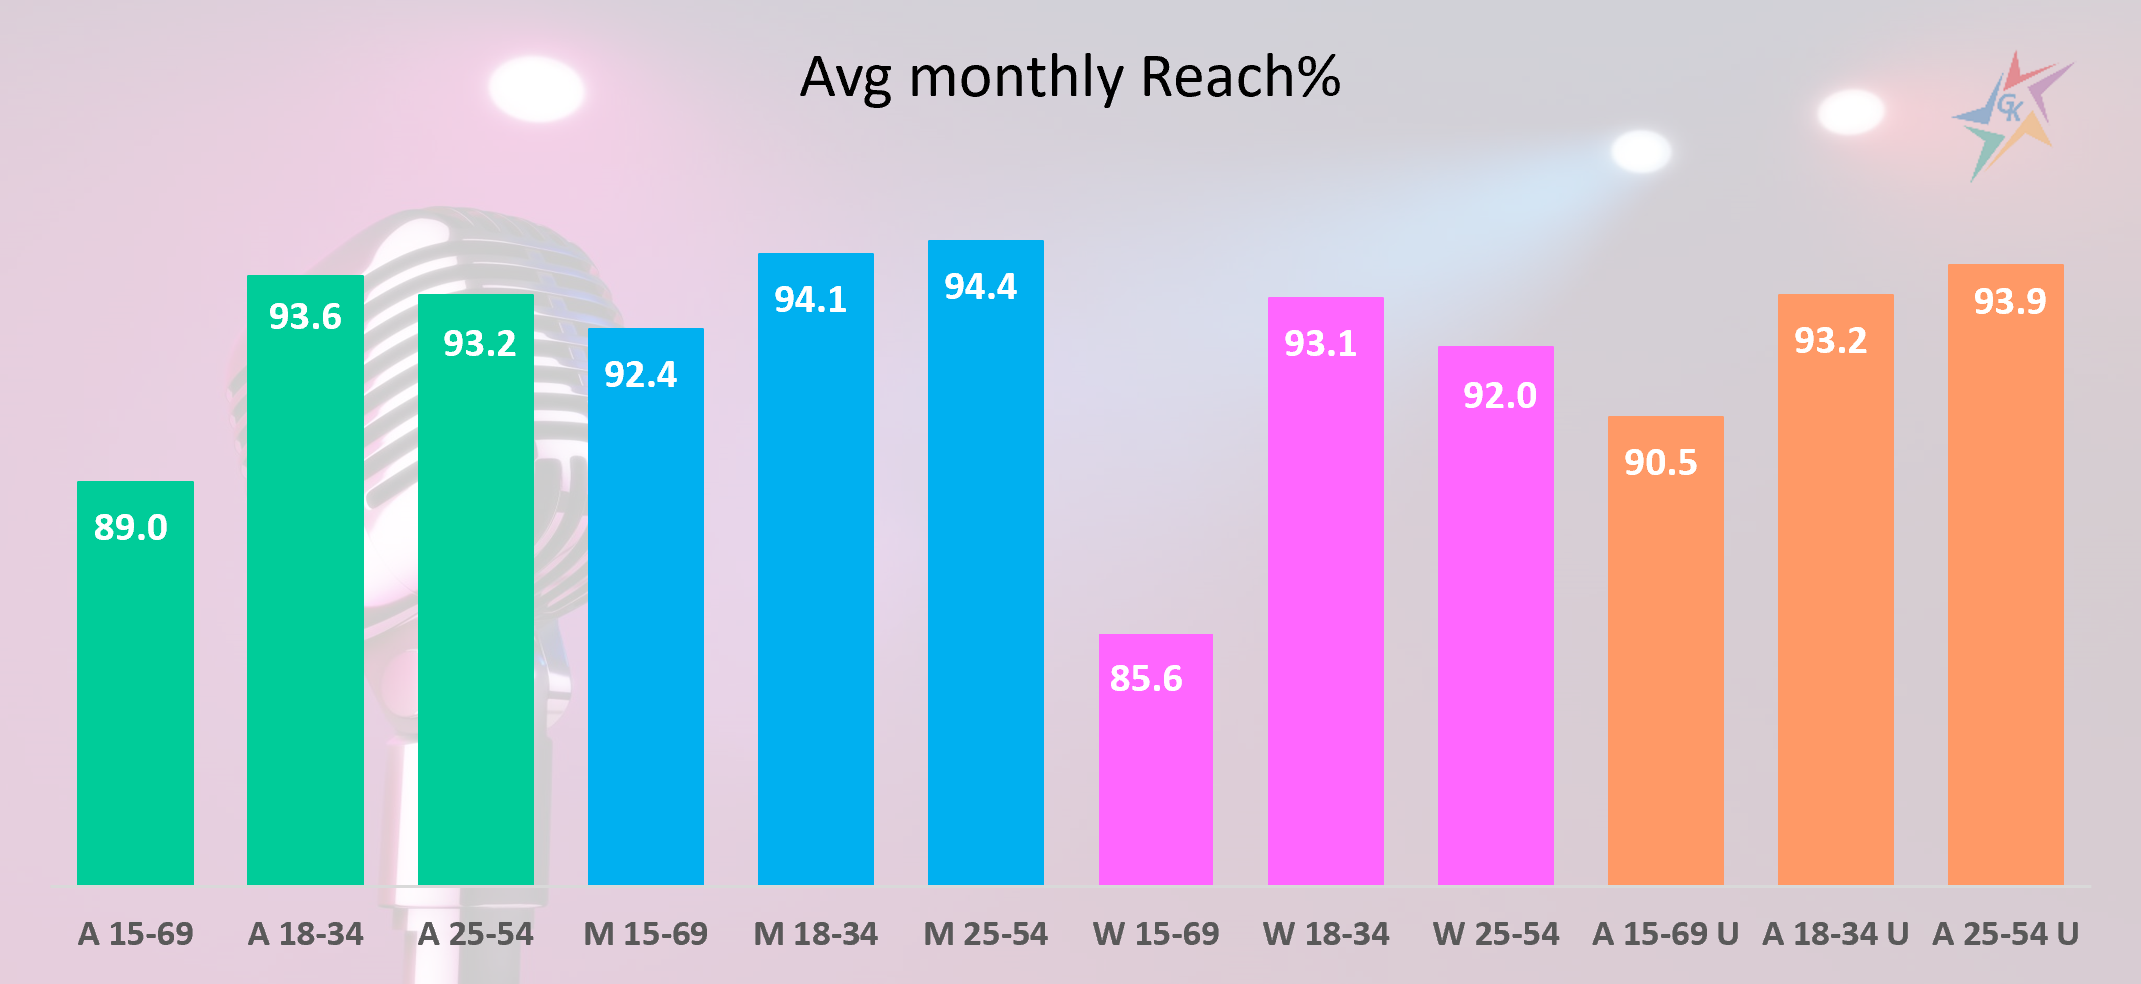
Radio is a media that accompanies the daily life of a large part of the population. Popular music and interesting shows on current topics find their audience in the dynamic everyday life. That is why this media channel is extremely popular among the economically active population. Its advantages are often used to announce events, tactical and promotional campaigns. To take a look at the habits of radio listeners and make full use of the media, we analyzed several key indicators, such as Reach%, number of minutes spent in listening to a radio, and a place where media is consumed.
The first indicator we looked at in detail is the average monthly Reach% that radio achieves in March 2021 for three main age groups – people aged 15 to 69, 18 to 34 and 25 to 54, divided by gender, total for the country and living in the cities:
Source: GARB. Period: March 2021.
In the broad target group A 15-69, the radio achieves 89% average monthly Reach%. The data for March 2021 is notable by the high average monthly Reach%, which the media achieves among the younger and economically active groups A 18-34 – 93.6% and A 25-54 – 93.2%. The range achieved by both is approximately 5% higher than in the broad target group A 15-69.
Men turn out to be more ardent fans of radio and the Reach% achieved by the media among them is higher among all three age groups compared to women. The most pronounced difference is between men and women aged 15-69 years. In this age group, radio achieves 7% higher coverage among male audiences than female. From the data presented in the chart we can conclude that the radio achieves a higher coverage among the urban audience.
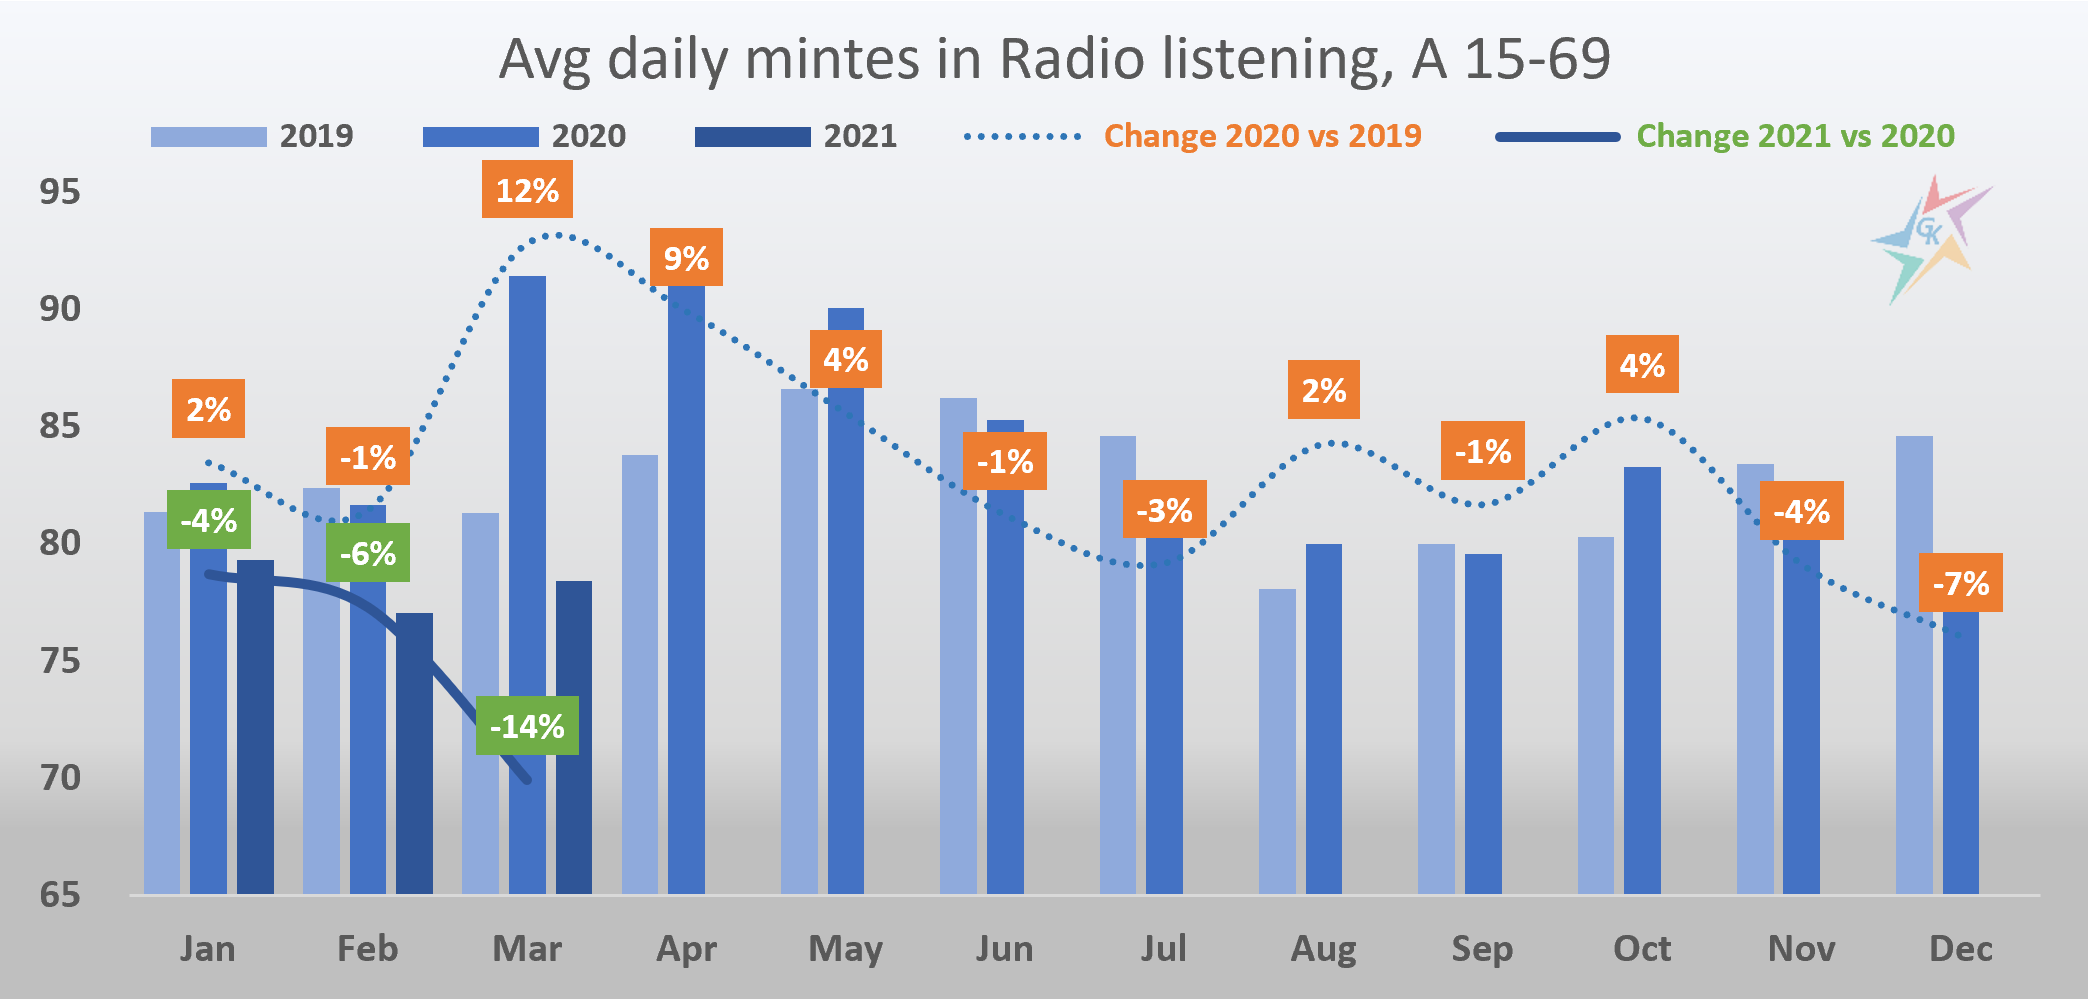
Another interesting indicator that reveals the habits of the audience is the time spent in listening to the radio. The advent of Covid-19 has led to a change in the consumption of all media. The biggest impact on the radio was due to relocation of the audience from office to a “home office”, as well as the less frequent use of personal and public transport. However, whether the closure at home leads to a decrease in radio listenership is shown by the following chart, which presents the minutes we spend on average per day for radio listening:
Source: GARB. Period: January 2019-March 2021.
The first two months of 2020 begin with data close to their relevant months in 2019. March 2020 is marked by the first lockdown for the country and by the growing hunger for information among the population. The change in lifestyle leads to higher media consumption and this is reflected in a 12% growth in the time we spend listening to the radio. This trend continues in April and May 2020, when the average daily listening in minutes continues to grow by 9% and by 4%, respectively. In the period June-September 2020 the situation in the country normalizes and the levels return to those of 2019, but with slight deviations. Growth is also evident in October 2020, when the pandemic situation in the country began to deteriorate again and many people prefer to stay at their homes. In the first quarter of 2021, the levels are lower compared to 2020, but radio programs did the best to keep listeners with interesting formats, games and a desire for dialogue between radio hosts and listeners.
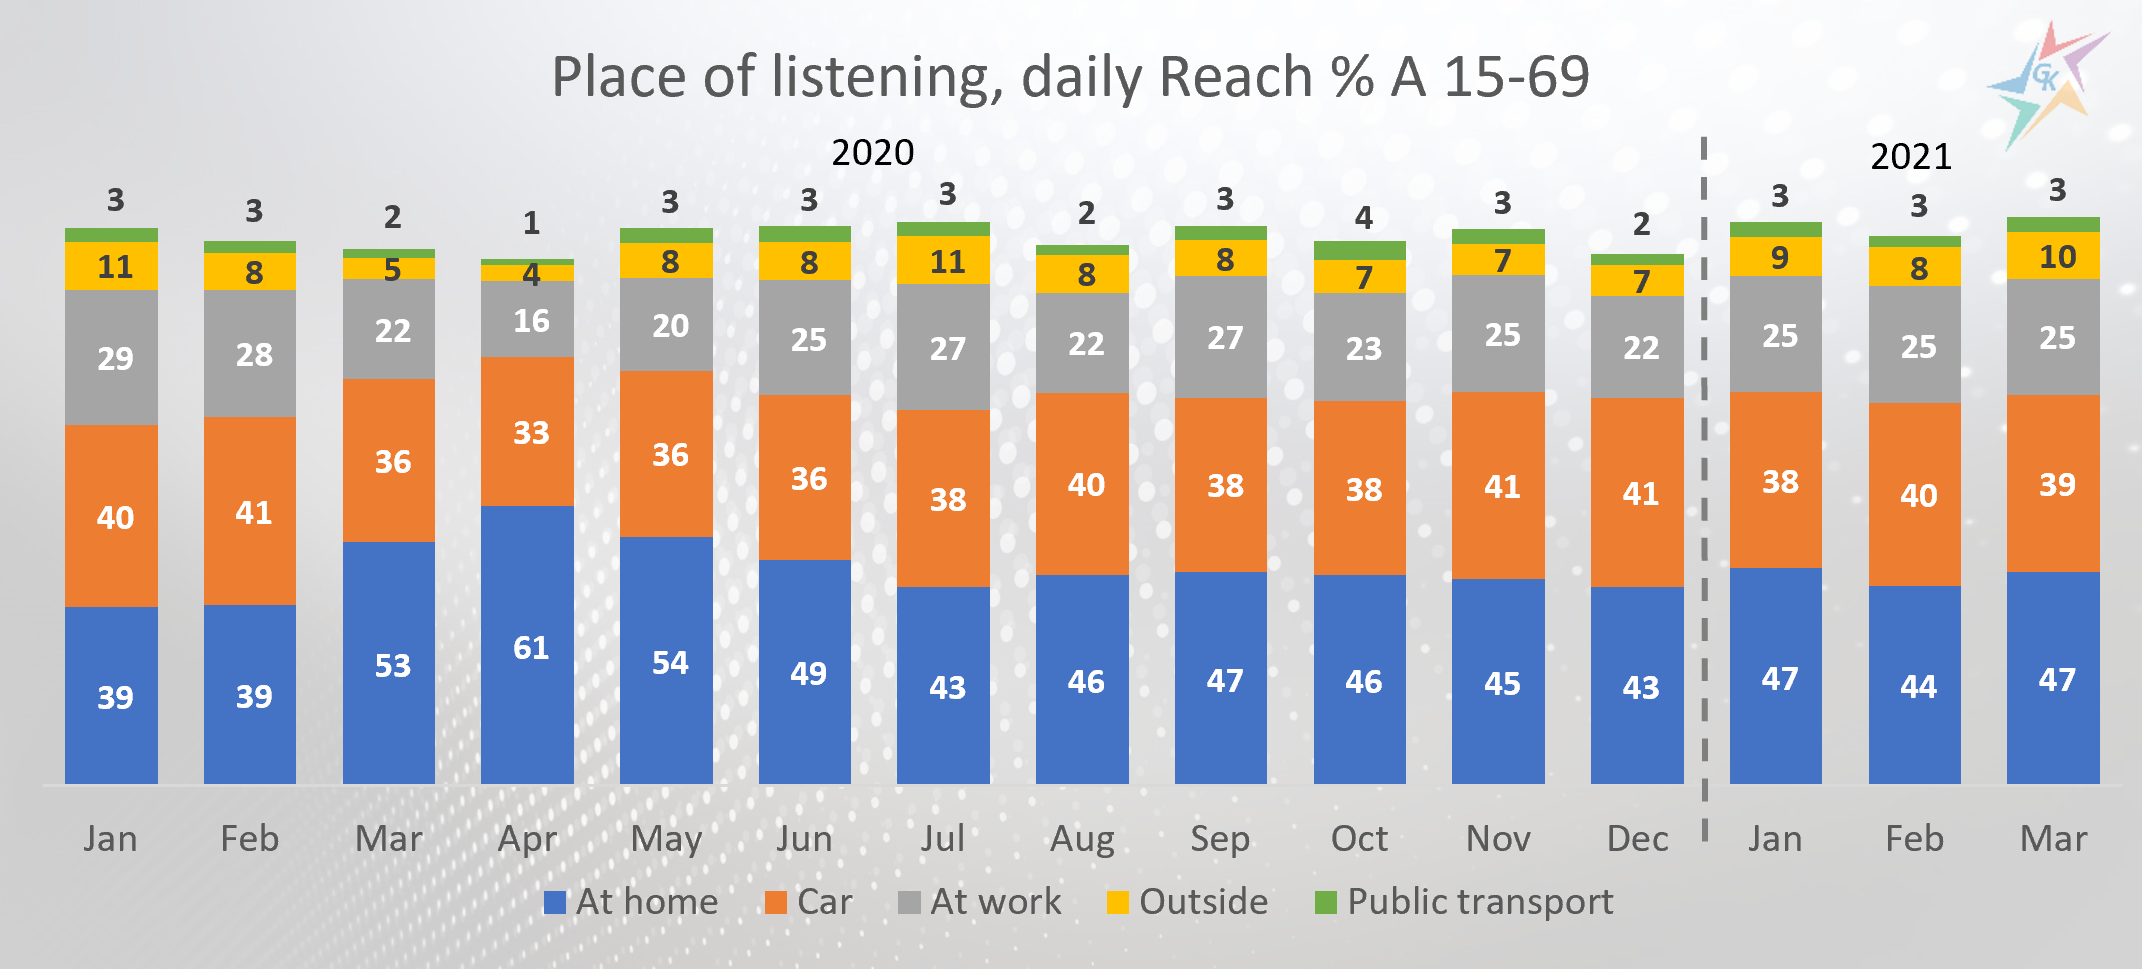
The following chart, which shows how habits are changing depending on the place where the audience listens to the radio, also leads to interesting conclusions:
Source: GARB. Period: January 2020-March 2021.
During the first two months of 2020, the radio has the highest daily Reach% in the car. The state of emergency in the country in March 2020 reversed the trend and people replaced the car and the office with the home environment. As a result, the audience changed their habits and began to use radio mostly at home. Workplace consumption lost its share during the year, but has been growing steadily since the beginning of 2021. The same goes for listening outside (in a restaurant, cafe, shop, outdoors, etc.), as well as in public transport, which is gradually starting to attract streams of people again. On the chart, the sum of the percentages is greater than 100, as in the presented survey the respondents indicated more than one way of listening.
For additional information, please contact our team via the contact form.
In early April, the NSI published its annual statistics on demographic processes in the country in 2020. Data for previous years are always of great interest because of the trends they outline. Knowledge of the general situation in the country helps in the analysis of consumers and the environment in which the business is placed. In this topic we have collected the main key points from the current data, the impact of which we analyzed with the help of charts.
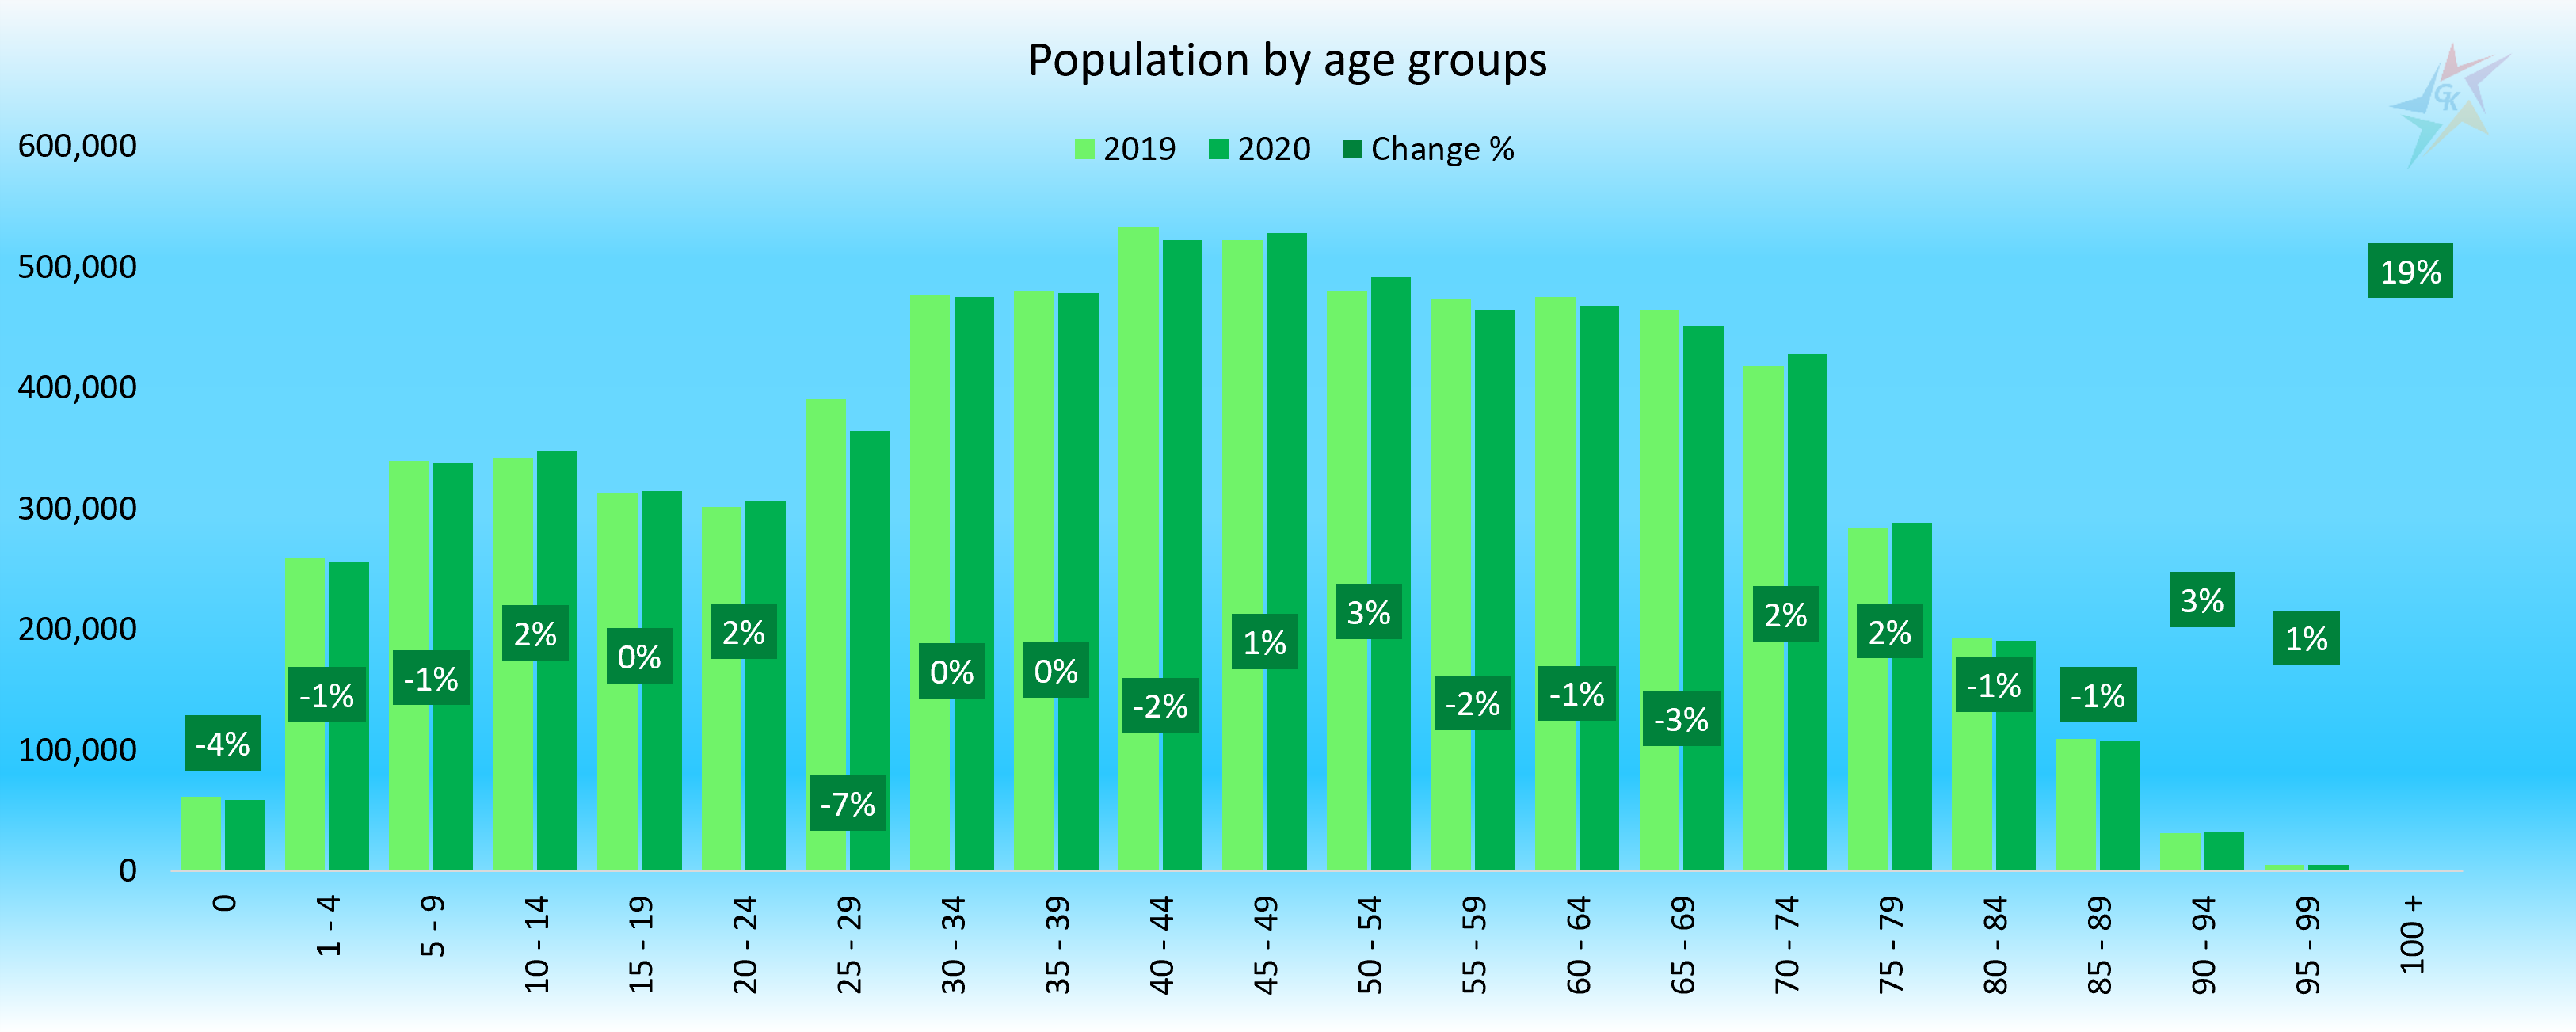
Declining and aging population of the country is one of the main trends, which is deepening in 2020. At the end of the year, the population of Bulgaria is 6,916,548 people, which means a decrease of 0.5% compared to 2019. For comparison, the population in the European Union is growing by 0.2% in 2020. Children under the age of 15 represent 14.4% of the total population. People at working age between 15 and 64 are 63.8%, and those aged 65+ are 21.8% of the nation. In 2020, the largest decline was registered by the economically active population – minus 0.7%, as well as children under 15 y.o. – minus 0.3%. The number of people in the oldest group remains unchanged, but their share compared to the other two groups rises by 0.1%. The chart presents the dynamics in different age groups in 2020 compared to 2019:
Source: NSI. Period: 2019-2020
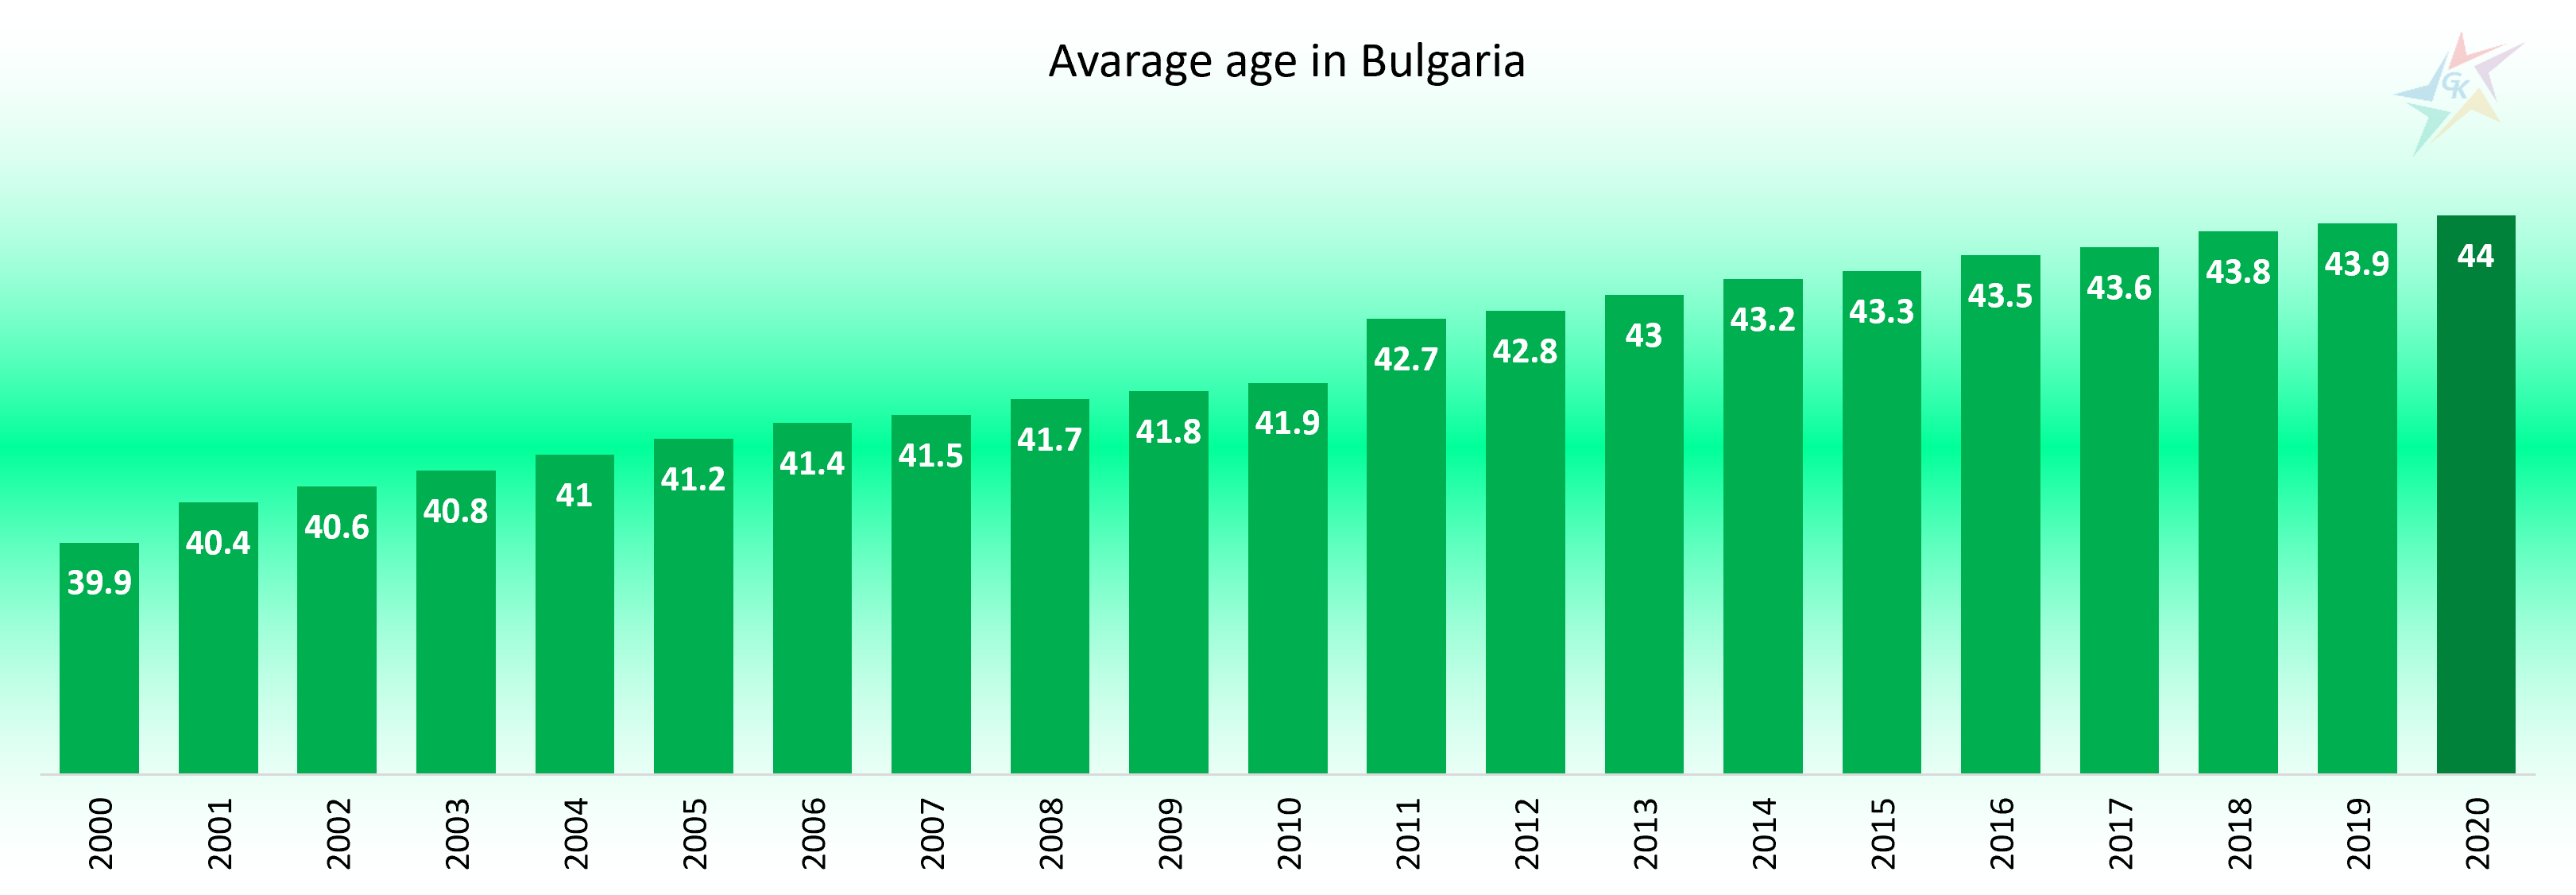
The following graph shows the average age in Bulgaria for the last 20 years:
Source: NSI. Period: 2000-2020
The past 2020 is another year in which the average age of the population in the country is rising. As of 31.12.2020 it reaches 44 years of age. The problem of aging is relevant throughout the EU community – in 2018 the average age reaches 43.1 years, and by 2050 it is expected to be 50 years.
In 2020, the share of women reaches 51.6%, which is 0.1% more than in 2019. There are 1,065 women per 1,000 men. The number of men under the age of 54 predominates over the number of women. Another interesting point from the current statistics is the age structure of men and women. With the increasing of age there is an emerging tendency of increase of the number and relative share of women. The aging process is more pronounced among women than among men. One of the reasons for this is the higher mortality rate among men and, therefore, the lower life expectancy among them. Last year, the largest number of men was between the ages of 30 and 54, and for women the upper limit increased up to 74 years. Compared to 2019, the largest increase in both genders is in the age group between 45 and 54 years. The largest decline in both, men and women, was reported by the group between 25 and 29 years. The next chart shows the distribution between the different age intervals for both genders:
Source: NSI. Period: 2020
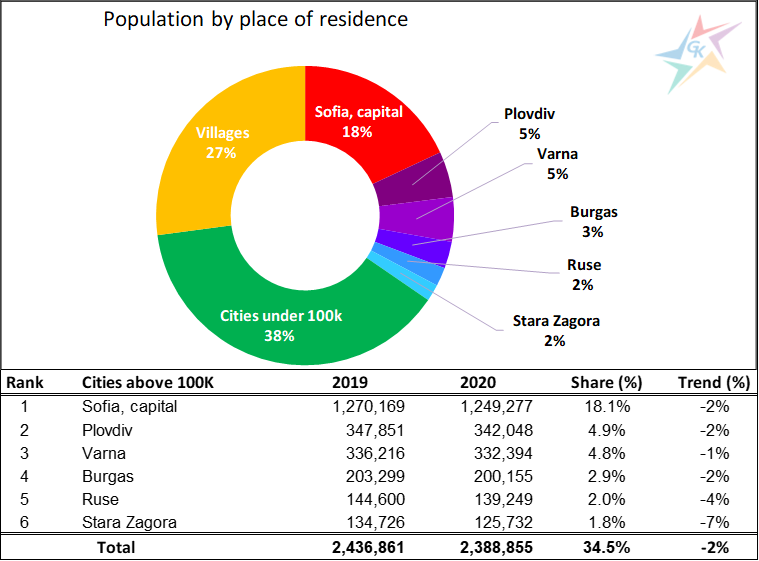
Another demographic feature of our country is the concentration of the population in the cities and depopulation of small settlements. As of 31.12.2020 the number of people living in cities reaches 72.9%, and those in the villages – 27.1%. Six cities in the country – Sofia, Plovdiv, Varna, Burgas, Ruse and Stara Zagora, have a population above 100,000 people and in total represents 35% of the country’s population:
Source: NSI. Period: 2019-2020
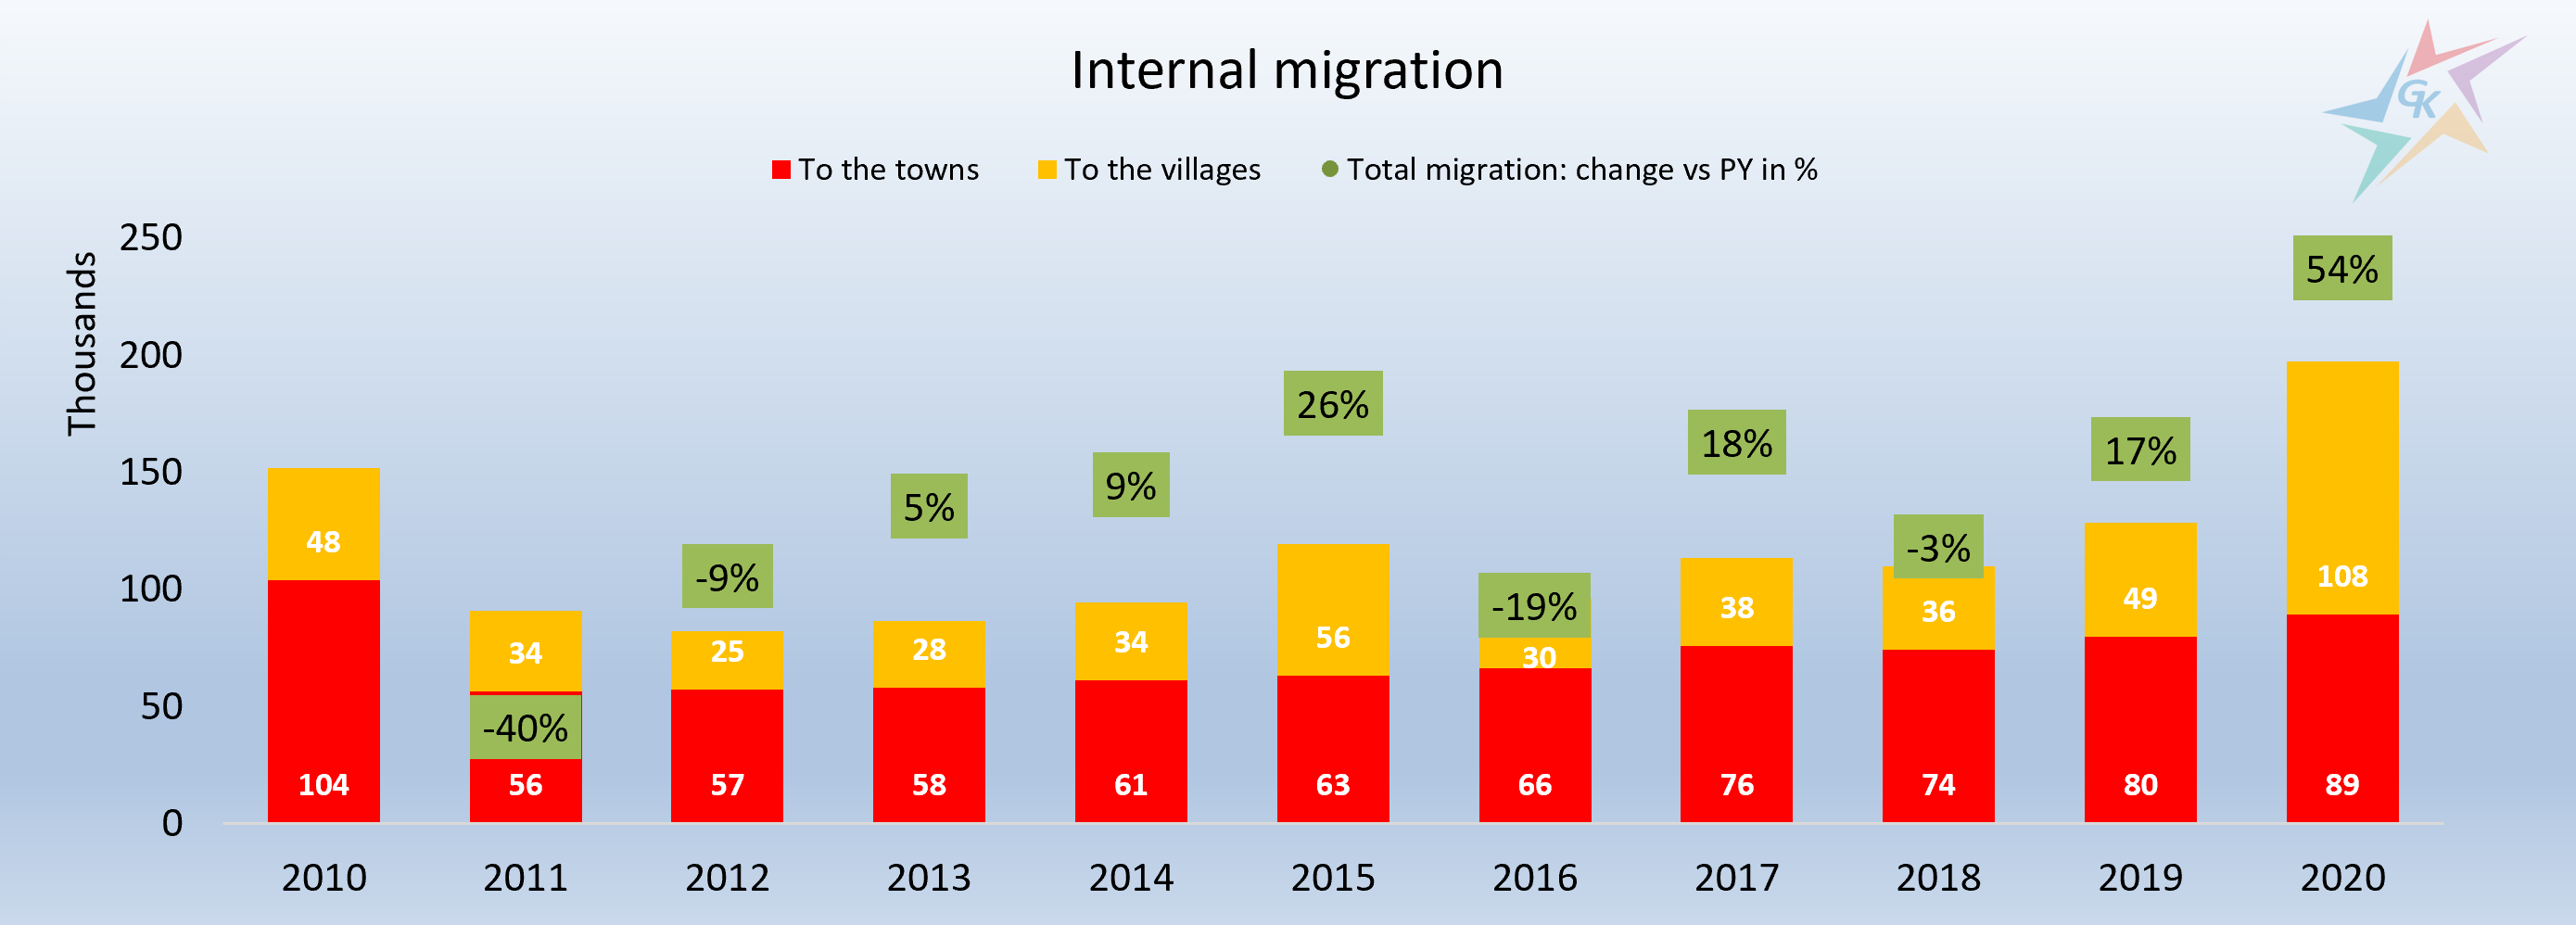
It is an interesting fact that in the past year the internal migration in the country increased by 53.9% compared to 2019:
Source: NSI. Period: 2010-2020
197,242 people have changed the settlement, and more than half of them (108,085 people) have preferred the life of a village to that of the city. This trend is clear from the data in the table above, according to which an average of 2% of the population leave the six largest cities. 2020 is the first year in the last ten years in which there is a greater internal migration towards villages than to the cities. The main reason for this can be found in the appearance of Covid-19 insulation and the ability to work remotely, which the pandemic imposed. The highest migration is in the direction “city – village” (48.4%). This is followed by migration in the direction “city – city” (29.9%) and “village – city” (15.3%). The migration share in the direction “village – village” has the lowest share – 6.4%.
For additional information, please contact our team via the contact form.